
Pengolahan Citra MRI Menggunakan Matlab
Magnetic Resonance Imaging (MRI) adalah suatu alat diagnostik untuk memeriksa dan mendeteksi organ tubuh dengan menggunakan medan magnet dan gelombang frekuensi radio (tanpa operasi, penggunaan sinar X ataupun bahan radioaktif). Tampilan pesawat MRI dan proses akuisisi citra ditunjukkan pada gambar berikut ini.
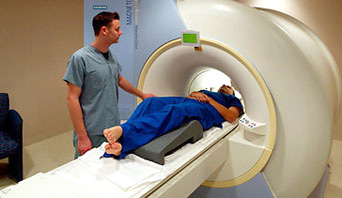
Proses akuisisi citra dengan modalitas MRI
Hasil pemeriksaan MRI adalah berupa rekaman citra potongan penampang tubuh/organ manusia dengan menggunakan medan magnet berkekuatan antara 0,064 – 1,5 Tesla dan resonansi getaran terhadap inti atom hidrogen. Contoh citra kepala hasil pemeriksaan dengan modalitas MRI ditunjukkan pada gambar di bawah ini.
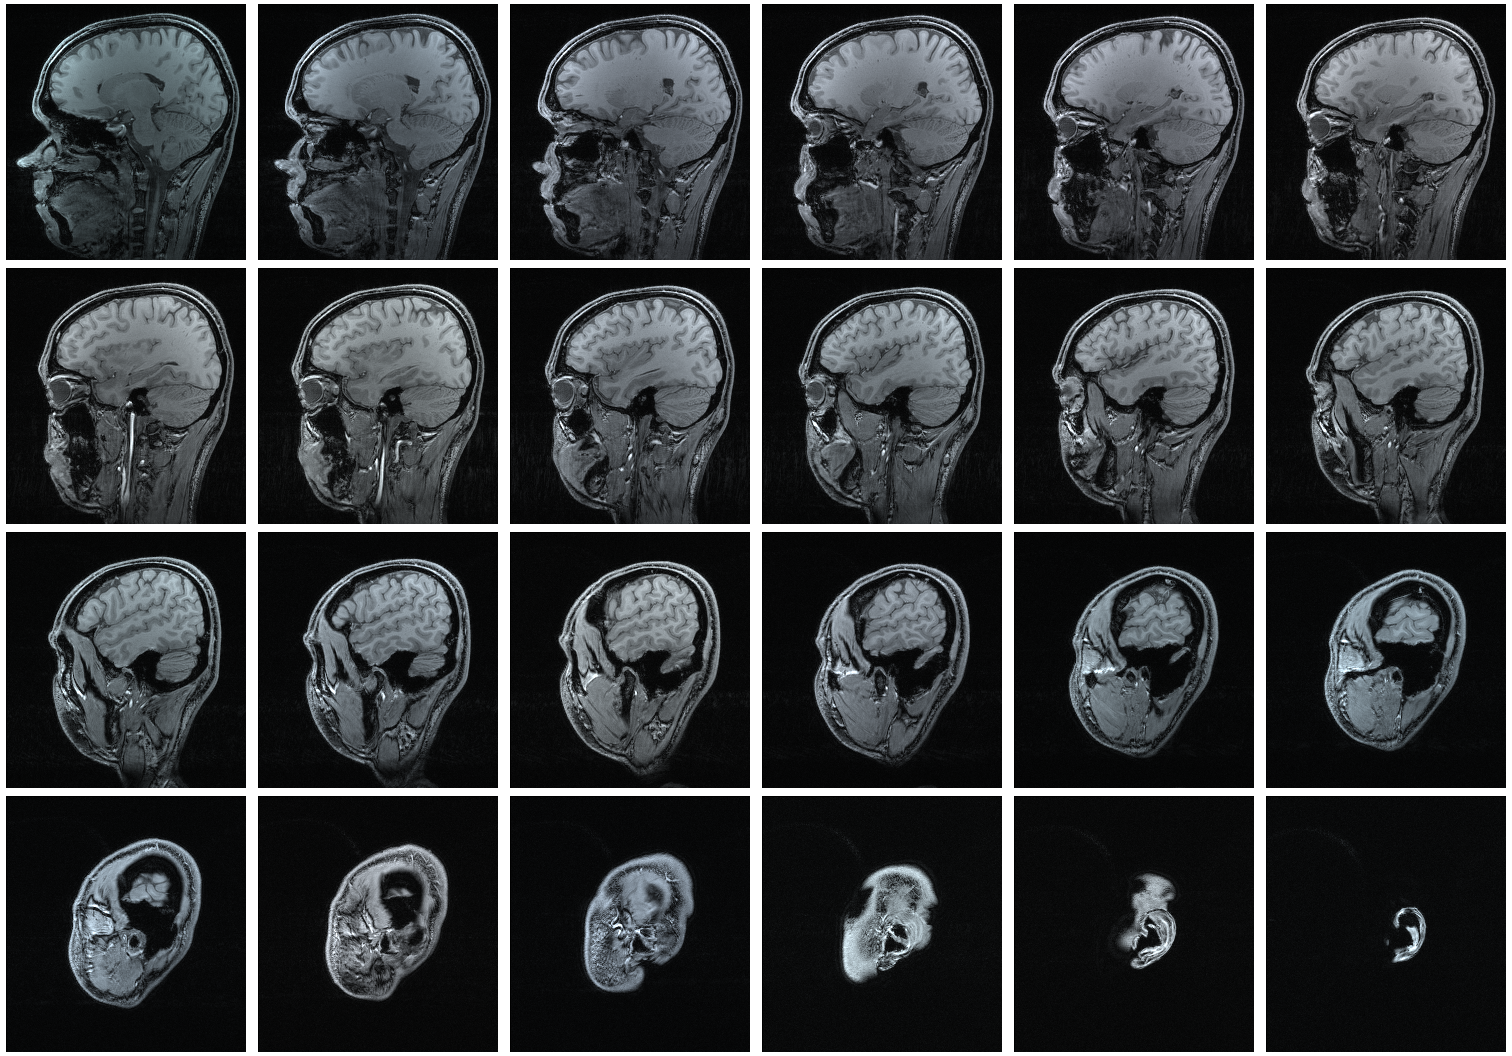
Citra hasil akuisisi dengan modalitas MRI
Dengan beberapa faktor kelebihan yang dimilikinya, terutama kemampuannya membuat potongan aksial, sagital, coronal, dan oblik tanpa banyak memanipulasi posisi tubuh pasien, membuat MRI sangat sesuai untuk proses diagnostik jaringan lunak.
Berikut ini merupakan contoh aplikasi programmatic GUI Matlab untuk pengolahan citra MRI dan visualisasi citra secara tiga dimensi. Koding dapat dijalankan minimal menggunakan matlab r2014b (karena menggunakan komponen baru yaitu uitab).
Citra MRI dalam matlab terdiri dari 27 slice tampang horizontal (axial). Tampang horizontal tersebut kemudian ditransformasi menjadi tampang sagittal (35 slice) dan tampang coronal (45 slice) menggunakan transformasi radon. Selanjutnya masing-masing tampang divisualisasikan secara tiga dimensi.
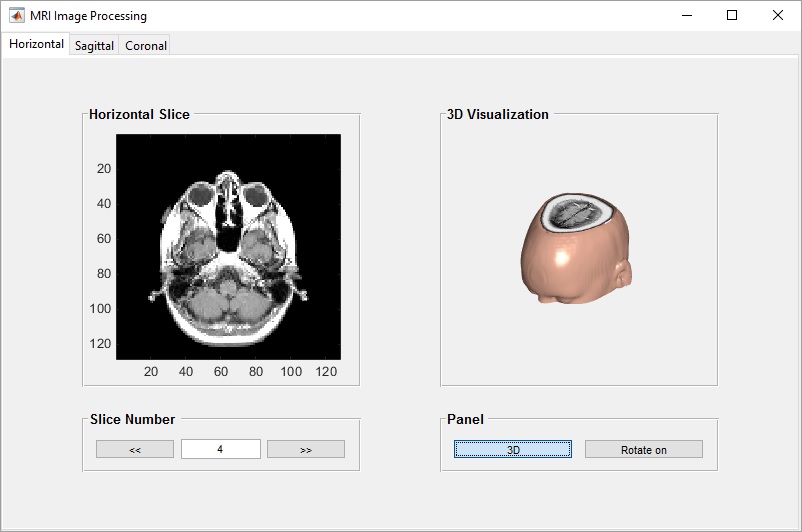
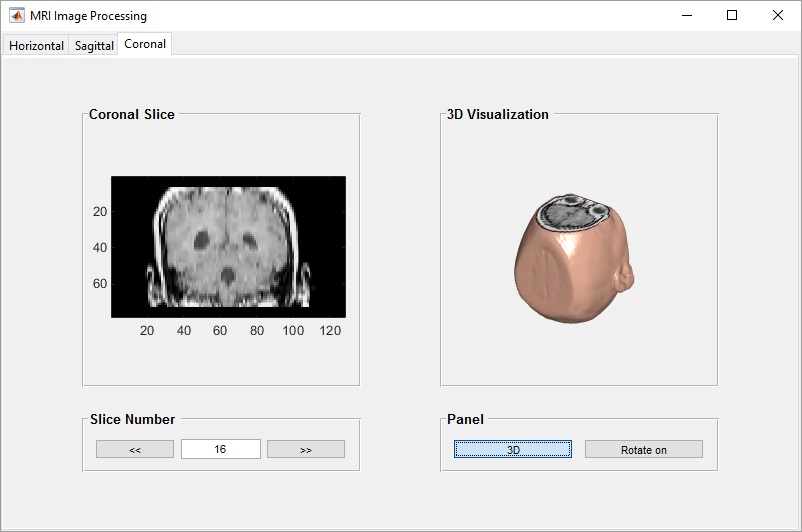
Tampilan GUI Matlab untuk melakukan pengolahan citra MRI adalah sebagai berikut:
1. Tampang horizontal (axial)
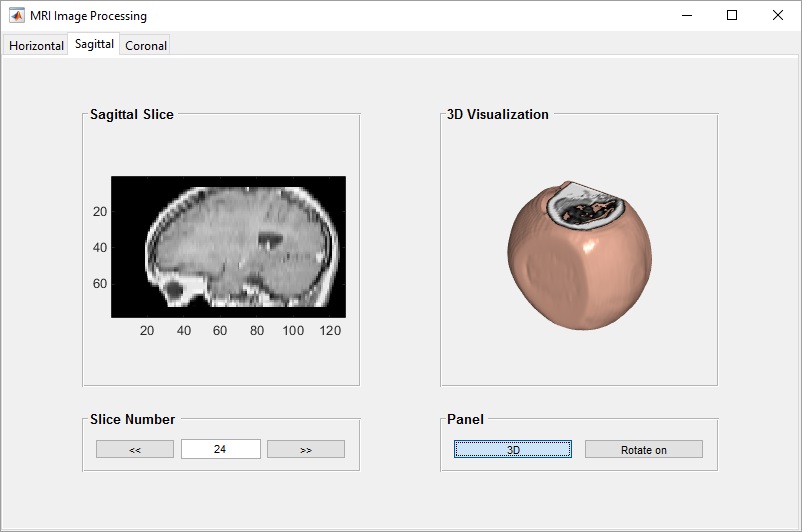
2. Tampang sagittal
3. Tampang coronal
File source code lengkap beserta citra untuk MRI Image Processing dapat diperoleh melalui halaman berikut ini: Source Code
Source code tersebut dapat dijalankan pada software matlab minimal versi R2014b karena menggunakan komponen baru yaitu uitab.
Tampilan source codenya adalah:
function mri_image_processing
global D map siz toggle1 toggle2
load mri
f = figure('Name','MRI Image Processing','MenuBar','none',...
    'ToolBar','none','NumberTitle','off','Position',[250 130 800 500]);

tgroup = uitabgroup('Parent', f);

tab1 = uitab('Parent', tgroup, 'Title', 'Horizontal');

panel1 = uipanel('Parent',tab1,'Title','Horizontal Slice','FontWeight','bold',...
    'FontSize',10,'Position',[.1 .3 .35 .6]);

panel2 = uipanel('Parent',tab1,'Title','Slice Number','FontWeight','bold',...
    'FontSize',10,'Position',[.1 .12 .35 .13]);

btn1 = uicontrol('Parent',panel2,'Style', 'pushbutton', 'String', '<<',...
    'Position', [12 12 80 20],'Callback', @pushbutton1);

btn2 = uicontrol('Parent',panel2,'Style', 'pushbutton', 'String', '>>',...
    'Position', [183 12 80 20],'Callback', @pushbutton2);

ax1 = axes('Parent',panel1,'Position',[.1 .1 .85 .85],'XTick',[],...
    'YTick',[],'Visible','off');

edit1 = uicontrol('Parent',panel2,'Style','edit','Enable','inactive',...
    'String','0','Position',[98 12 80 20]);

tab2 = uitab('Parent', tgroup, 'Title', 'Sagittal');

panel3 = uipanel('Parent',tab2,'Title','Sagittal Slice','FontWeight','bold',...
    'FontSize',10,'Position',[.1 .3 .35 .6]);

panel4 = uipanel('Parent',tab2,'Title','Slice Number','FontWeight','bold',...
    'FontSize',10,'Position',[.1 .12 .35 .13]);

btn3 = uicontrol('Parent',panel4,'Style', 'pushbutton', 'String', '<<',...
    'Position', [12 12 80 20],'Callback', @pushbutton3);

btn4 = uicontrol('Parent',panel4,'Style', 'pushbutton', 'String', '>>',...
    'Position', [183 12 80 20],'Callback', @pushbutton4);

ax2 = axes('Parent',panel3,'Position',[.1 .1 .85 .85],'XTick',[],...
    'YTick',[],'Visible','off');

edit2 = uicontrol('Parent',panel4,'Style','edit','Enable','inactive',...
    'String','0','Position',[98 12 80 20]);

tab3 = uitab('Parent', tgroup, 'Title', 'Coronal');

panel5 = uipanel('Parent',tab3,'Title','Coronal Slice','FontWeight','bold',...
    'FontSize',10,'Position',[.1 .3 .35 .6]);

panel6 = uipanel('Parent',tab3,'Title','Slice Number','FontWeight','bold',...
    'FontSize',10,'Position',[.1 .12 .35 .13]);

btn5 = uicontrol('Parent',panel6,'Style', 'pushbutton', 'String', '<<',...
    'Position', [12 12 80 20],'Callback', @pushbutton5);

btn6= uicontrol('Parent',panel6,'Style', 'pushbutton', 'String', '>>',...
    'Position', [183 12 80 20],'Callback', @pushbutton6);

ax3 = axes('Parent',panel5,'Position',[.1 .1 .85 .85],'XTick',[],...
    'YTick',[],'Visible','off');

edit3 = uicontrol('Parent',panel6,'Style','edit','Enable','inactive',...
    'String','0','Position',[98 12 80 20]);


panel7 = uipanel('Parent',tab1,'Title','3D Visualization','FontWeight','bold',...
    'FontSize',10,'Position',[.55 .3 .35 .6]);

panel8 = uipanel('Parent',tab1,'Title','Panel','FontWeight','bold',...
    'FontSize',10,'Position',[.55 .12 .35 .13]);

toggle1 = uicontrol('Parent',panel8,'Style', 'togglebutton', 'String', '3D',...
    'Position', [12 12 120 20],'Callback', @togglebutton1);

toggle2 = uicontrol('Parent',panel8,'Style', 'togglebutton', 'String', 'Rotate on',...
    'Position', [143 12 120 20],'Callback', @togglebutton2);

ax4 = axes('Parent',panel7,'Position',[.1 .1 .85 .85],'XTick',[],...
    'YTick',[],'Visible','off');

panel9 = uipanel('Parent',tab2,'Title','3D Visualization','FontWeight','bold',...
    'FontSize',10,'Position',[.55 .3 .35 .6]);

panel10 = uipanel('Parent',tab2,'Title','Panel','FontWeight','bold',...
    'FontSize',10,'Position',[.55 .12 .35 .13]);

toggle3 = uicontrol('Parent',panel10,'Style', 'togglebutton', 'String', '3D',...
    'Position', [12 12 120 20],'Callback', @togglebutton3);

toggle4 = uicontrol('Parent',panel10,'Style', 'togglebutton', 'String', 'Rotate on',...
    'Position', [143 12 120 20],'Callback', @togglebutton4);

ax5 = axes('Parent',panel9,'Position',[.1 .1 .85 .85],'XTick',[],...
    'YTick',[],'Visible','off');

panel11 = uipanel('Parent',tab3,'Title','3D Visualization','FontWeight','bold',...
    'FontSize',10,'Position',[.55 .3 .35 .6]);

panel12 = uipanel('Parent',tab3,'Title','Panel','FontWeight','bold',...
    'FontSize',10,'Position',[.55 .12 .35 .13]);

toggle5 = uicontrol('Parent',panel12,'Style', 'togglebutton', 'String', '3D',...
    'Position', [12 12 120 20],'Callback', @togglebutton5);

toggle6 = uicontrol('Parent',panel12,'Style', 'togglebutton', 'String', 'Rotate on',...
    'Position', [143 12 120 20],'Callback', @togglebutton6);

ax6 = axes('Parent',panel11,'Position',[.1 .1 .85 .85],'XTick',[],...
    'YTick',[],'Visible','off');

    function pushbutton1(~,~)
        image_num = str2double(get(edit1,'string'));

        if image_num > 1
            image_num = image_num-1;

            axes(ax1);
            image(D(:,:,image_num));
            axis image;
            colormap(map);
            set(edit1, 'string', image_num);
        else
            image_num = 0;
            axes(ax1)
            cla reset
            set(gca,'XTick',[])
            set(gca,'YTick',[])
            set(ax1,'Visible','off')
            set(edit1, 'string', image_num);
        end
    end

    function pushbutton2(~,~)
        image_num = str2double(get(edit1,'string'));

        if image_num < 27
            image_num = image_num+1;
        else
            image_num = 27;
        end

        axes(ax1);
        image(D(:,:,image_num));
        axis image;
        colormap(map);
        set(edit1, 'string', image_num);
    end

    function pushbutton3(~,~)
        image_num = str2double(get(edit2,'string'));

        if image_num > 1
            image_num = image_num-1;

            R3 = makeresampler({'cubic','nearest','nearest'},'fill');
            T3 = maketform('affine',[-2.5 0 0; 0 1 0; 0 0 0.5; 68.5 0 -14]);
            S = tformarray(D,T3,R3,[4 1 2],[1 2 4],[66 128 35],[],0);
            S2 = padarray(S,[6 0 0 0],0,'both');
            S2 = squeeze(S2);

            axes(ax2);
            imagesc(S2(:,:,image_num));
            axis image;
            colormap(map);
            set(edit2, 'string', image_num);
        else
            image_num = 0;
            axes(ax2)
            cla reset
            set(gca,'XTick',[])
            set(gca,'YTick',[])
            set(ax2,'Visible','off')
            set(edit2,'string',image_num)
        end
    end

    function pushbutton4(~,~)
        image_num = str2double(get(edit2,'string'));

        if image_num < 35
            image_num = image_num+1;
        else
            image_num = 35;
        end

        R3 = makeresampler({'cubic','nearest','nearest'},'fill');
        T3 = maketform('affine',[-2.5 0 0; 0 1 0; 0 0 0.5; 68.5 0 -14]);
        S = tformarray(D,T3,R3,[4 1 2],[1 2 4],[66 128 35],[],0);
        S2 = padarray(S,[6 0 0 0],0,'both');
        S2 = squeeze(S2);

        axes(ax2);
        imagesc(S2(:,:,image_num));
        axis image;
        colormap(map);
        set(edit2, 'string', image_num);
    end

    function pushbutton5(~,~)
        image_num = str2double(get(edit3,'string'));

        if image_num > 1
            image_num = image_num-1;

            R3 = makeresampler({'cubic','nearest','nearest'},'fill');
            T4 = maketform('affine',[-2.5 0 0; 0 1 0; 0 0 -0.5; 68.5 0 61]);
            C = tformarray(D,T4,R3,[4 2 1],[1 2 4],[66 128 45],[],0);
            C2 = padarray(C,[6 0 0 0],0,'both');
            C2 = squeeze(C2);

            axes(ax3);
            imagesc(C2(:,:,image_num));
            axis image;
            colormap(map);
            set(edit3, 'string', image_num);
        else
            image_num = 0;
            axes(ax3)
            cla reset
            set(gca,'XTick',[])
            set(gca,'YTick',[])
            set(ax3,'Visible','off')
            set(edit3, 'string', image_num)
        end
    end

    function pushbutton6(~,~)
        image_num = str2double(get(edit3,'string'));

        if image_num < 45
            image_num = image_num+1;
        else
            image_num = 45;
        end

        R3 = makeresampler({'cubic','nearest','nearest'},'fill');
        T4 = maketform('affine',[-2.5 0 0; 0 1 0; 0 0 -0.5; 68.5 0 61]);
        C = tformarray(D,T4,R3,[4 2 1],[1 2 4],[66 128 45],[],0);
        C2 = padarray(C,[6 0 0 0],0,'both');
        C2 = squeeze(C2);

        axes(ax3);
        imagesc(C2(:,:,image_num));
        axis image;
        colormap(map);
        set(edit3, 'string', image_num);
    end

    function togglebutton1(~,~)
        val1 = get(toggle1,'Value');
        if val1 == 1
            axes(ax4);
            Ds = smooth3(squeeze(D));
            hiso = patch(isosurface(Ds,5),...
                'FaceColor',[1,.75,.65],...
                'EdgeColor','none');
            isonormals(Ds,hiso)

            hcap = patch(isocaps(squeeze(D),5),...
                'FaceColor','interp',...
                'EdgeColor','none');

            view(35,30)
            axis off
            colormap(map)
            daspect([1,1,.4])

            lightangle(45,30);
            set(gcf,'Renderer','zbuffer'); lighting phong
            set(hcap,'AmbientStrength',.6)
            set(hiso,'SpecularColorReflectance',0,'SpecularExponent',50)
        else
            axes(ax4);
            cla reset
            set(gca,'XTick',[])
            set(gca,'YTick',[])
            set(ax4,'Visible','off')
        end
    end

    function togglebutton2(~,~)
        val1 = get(toggle2,'Value');
        if val1 == 1
            rotate3d(ax4,'on');
            set(toggle2,'string','Rotate off')
        else
            rotate3d(ax4,'off');
            set(toggle2,'string','Rotate on')
        end
    end

    function togglebutton3(~,~)
        val1 = get(toggle3,'Value');
        if val1 == 1
            axes(ax5);
            R3 = makeresampler({'cubic','nearest','nearest'},'fill');
            T3 = maketform('affine',[-2.5 0 0; 0 1 0; 0 0 0.5; 68.5 0 -14]);
            S = tformarray(D,T3,R3,[4 1 2],[1 2 4],[66 128 35],[],0);
            S2 = padarray(S,[6 0 0 0],0,'both');
            Ds = smooth3(squeeze(S2));
            hiso = patch(isosurface(Ds,5),...
                'FaceColor',[1,.75,.65],...
                'EdgeColor','none');
            isonormals(Ds,hiso)

            hcap = patch(isocaps(squeeze(S2),5),...
                'FaceColor','interp',...
                'EdgeColor','none');

            view(35,30)
            axis off
            colormap(map)
            daspect([1,1,.4])

            lightangle(45,30);
            set(gcf,'Renderer','zbuffer'); lighting phong
            set(hcap,'AmbientStrength',.6)
            set(hiso,'SpecularColorReflectance',0,'SpecularExponent',50)
        else
            axes(ax5);
            cla reset
            set(gca,'XTick',[])
            set(gca,'YTick',[])
            set(ax5,'Visible','off')
        end
    end

    function togglebutton4(~,~)
        val1 = get(toggle4,'Value');
        if val1 == 1
            rotate3d(ax5,'on');
            set(toggle4,'string','Rotate off')
        else
            rotate3d(ax5,'off');
            set(toggle4,'string','Rotate on')
        end
    end

    function togglebutton5(~,~)
        val1 = get(toggle5,'Value');
        if val1 == 1
            axes(ax6);
            R3 = makeresampler({'cubic','nearest','nearest'},'fill');
            T4 = maketform('affine',[-2.5 0 0; 0 1 0; 0 0 -0.5; 68.5 0 61]);
            C = tformarray(D,T4,R3,[4 2 1],[1 2 4],[66 128 45],[],0);
            C2 = padarray(C,[6 0 0 0],0,'both');
            C2 = squeeze(C2);
            Ds = smooth3(squeeze(C2));
            hiso = patch(isosurface(Ds,5),...
                'FaceColor',[1,.75,.65],...
                'EdgeColor','none');
            isonormals(Ds,hiso)

            hcap = patch(isocaps(squeeze(C2),5),...
                'FaceColor','interp',...
                'EdgeColor','none');

            view(35,30)
            axis off
            colormap(map)
            daspect([.85,.85,.4])

            lightangle(45,30);
            set(gcf,'Renderer','zbuffer'); lighting phong
            set(hcap,'AmbientStrength',.6)
            set(hiso,'SpecularColorReflectance',0,'SpecularExponent',50)
        else
            axes(ax6);
            cla reset
            set(gca,'XTick',[])
            set(gca,'YTick',[])
            set(ax6,'Visible','off')
        end
    end

    function togglebutton6(~,~)
        val1 = get(toggle6,'Value');
        if val1 == 1
            rotate3d(ax6,'on');
            set(toggle6,'string','Rotate off')
        else
            rotate3d(ax6,'off');
            set(toggle6,'string','Rotate on')
        end
    end
end
Posted on December 29, 2015, in Pengolahan Citra and tagged aplikasi pengolahan citra digital menggunakan matlab, aplikasi pengolahan citra medis, axial, cara membuat gui matlab pengolahan citra digital, cara menampilkan citra pada matlab, citra biner, citra grayscale, citra MRI Matlab, contoh gui matlab pengolahan citra, contoh program matlab pengolahan citra, contoh program matlab sederhana, coronal, gui matlab, image processing, MRI image, mri image processing, pengolahan citra CT scan matlab, pengolahan citra dicom, Pengolahan Citra Digital, pengolahan citra digital menggunakan GUI Matlab, pengolahan citra digital menggunakan matlab, pengolahan citra grayscale menggunakan matlab, pengolahan citra medis, pengolahan citra medis 3 dimensi, pengolahan citra MRI matlab, sagittal, slice axial, slice coronal, slice sagittal. Bookmark the permalink. 2 Comments.


kak apa bisa minta datanya?
Source code lengkap beserta data bisa dibeli melalui tokopedia