
Ekualisasi Histogram pada Citra Digital
Histogram Citra merupakan diagram yang menunjukkan distribusi nilai intensitas cahaya pada suatu citra. Pada histogram, sumbu-x menyatakan nilai intensitas piksel sedangkan sumbu-y menyatakan frekuensi kemunculan piksel. Dalam bidang pengolahan citra digital, terkadang perlu dilakukan pre-processing yang merupakan proses perbaikan kualitas citra dengan tujuan untuk memudahkan manusia atau komputer untuk merepresentasikan citra. Salah satu metode perbaikan kualitas citra adalah perataan histogram atau yang sering disebut sebagai histogram equalization.
Berikut ini merupakan contoh aplikasi pemrograman matlab untuk melakukan ekualisasi histogram citra secara manual.
Langkah-langkahnya adalah:
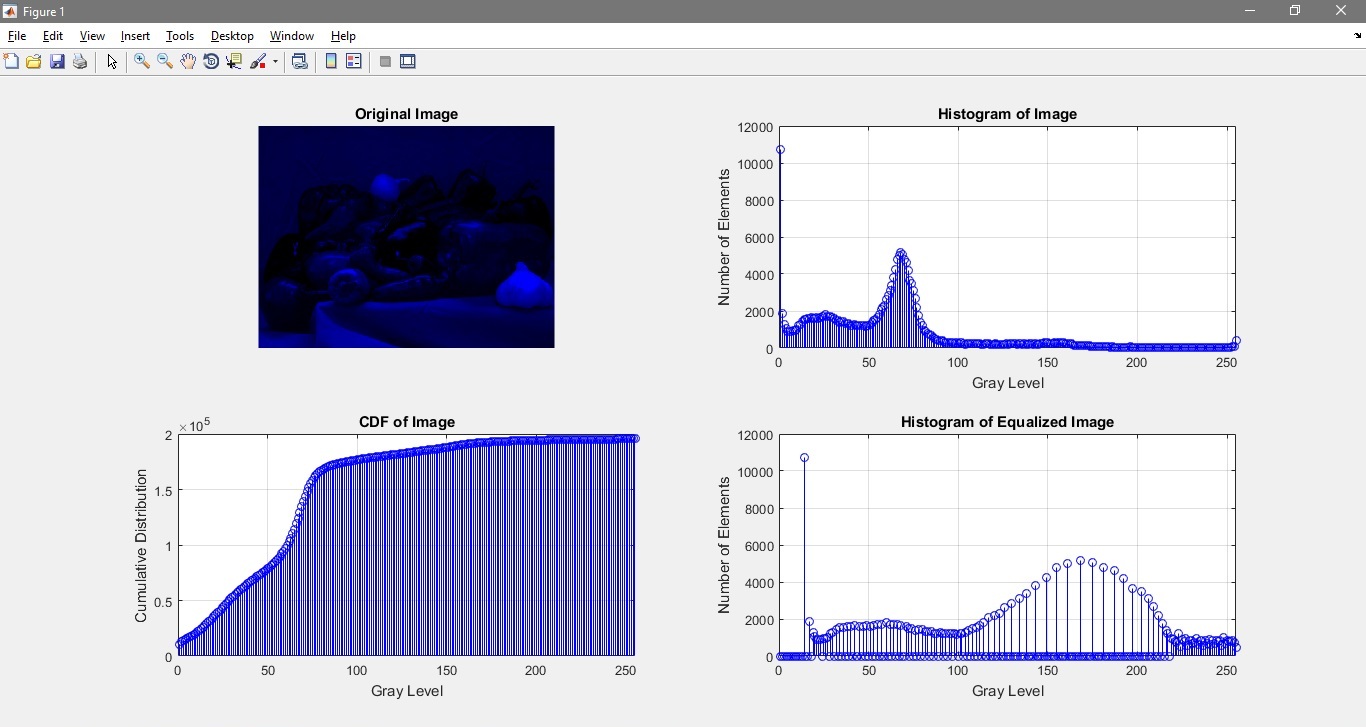
1. Membaca citra grayscale
clc;clear;close all;

I = imread('pout.tif');
figure, imshow(I);
title('Original Image')

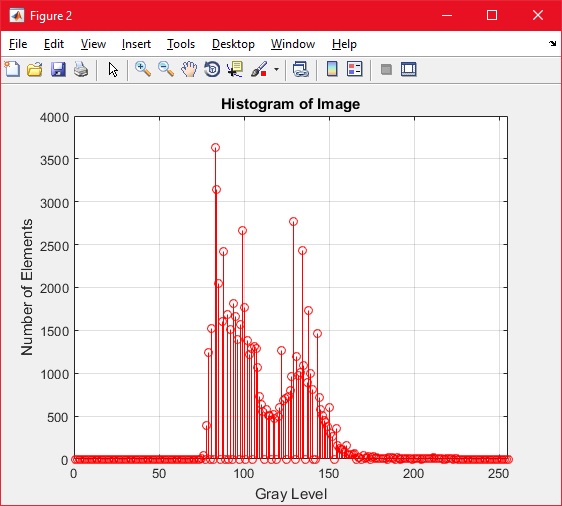
2. Membuat dan menampilkan histogram citra
[rows,cols] = size(I);

%% Histogram array
myhist = zeros(256,1);
for k = 0:255
    myhist(k+1) = numel(find(I==k)); % number of elements where I has gray level equal to 'k'
end
figure, stem(myhist,'r');
set(gca,'XLim',[0 255])
xlabel('Gray Level')
ylabel('Number of Elements')
title('Histogram of Image')
grid on
% End of Histogram array
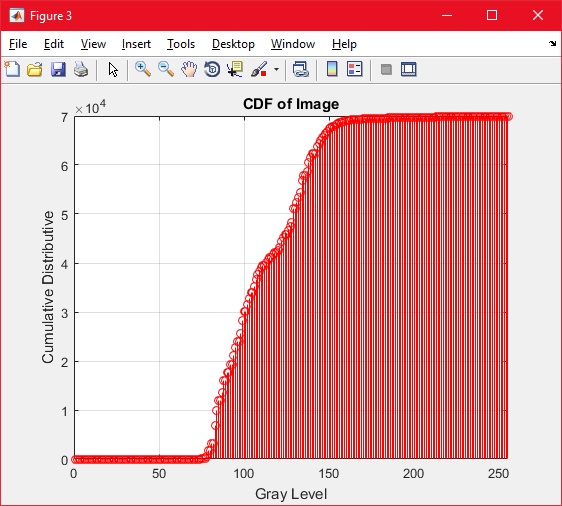
3. Membuat dan menampilkan CDF (Cumulative Distributive Function)
%% Calculate cdf
cdf = zeros(256,1);
cdf(1) = myhist(1);
for k = 2:256
    cdf(k) = cdf(k-1)+myhist(k);
end
figure, stem(cdf,'r');
set(gca,'XLim',[0 255])
xlabel('Gray Level')
ylabel('Cumulative Distribution')
title('CDF of Image')
grid on
% End of Calculate cdf
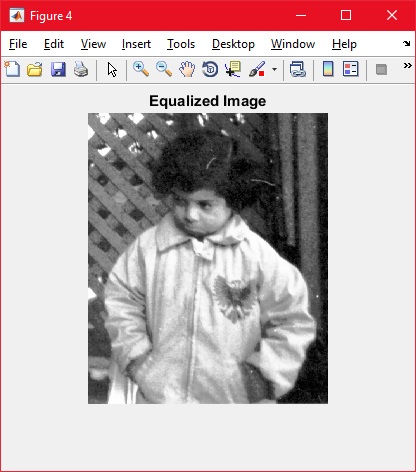
4. Melakukan ekualisasi gray level pada citra
%% Find Equalized histogram array
J = I;
cumprob = cdf/(rows.*cols);
equalizedhist = floor((cumprob).*255);

for i = 1:rows
    for j = 1:cols
        for m = 0:255
            if (I(i,j)==m)
                J(i,j) = equalizedhist(m+1);
            end
        end
    end
end

figure, imshow(J);
title('Equalized Image')
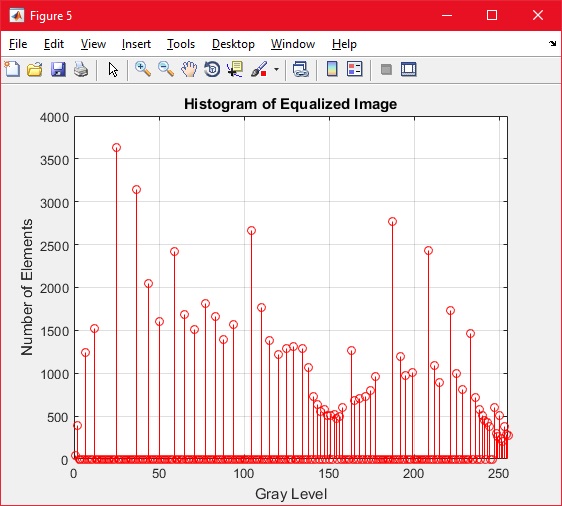
5. Menampilkan histogram citra setelah diekualisasi
%% Equalized Histogram array
myeqhist = zeros(256,1);
for k = 0:255
    myeqhist(k+1) = numel(find(J==k));
end
figure, stem(myeqhist,'r');
set(gca,'XLim',[0 255])
xlabel('Gray Level')
ylabel('Number of Elements')
title('Histogram of Equalized Image')
grid on
% End of Equalized Histogram array
Ekualisasi histogram dapat pula dilakukan pada citra RGB. Langkah-langkahnya yaitu:
1. Membaca citra RGB dan menampilkan histogramnya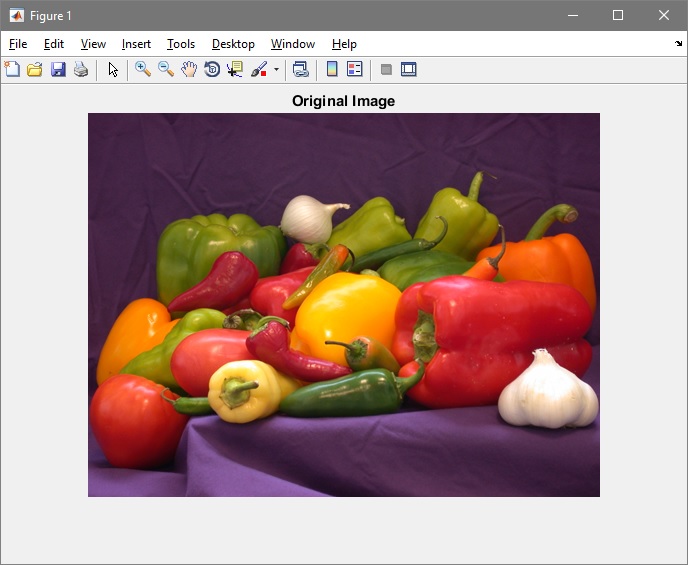
2. Melakukan ekualisasi histogram pada masing-masing kanal warna R, G, dan B
3. Menggabungkan kembali kanal warna R, G, dan B setelah diekualisasi dan menampilkan histogramnya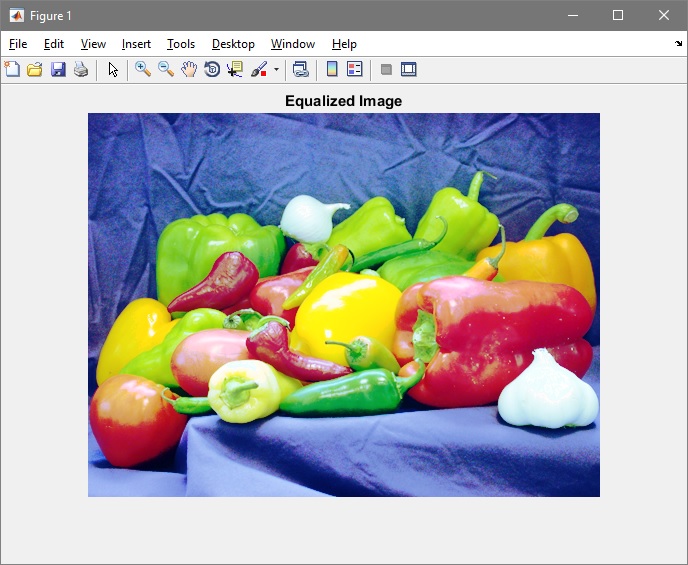
Tampilan source code untuk melakukan ekualisasi histogram citra RGB adalah:
clc;clear;close all;
I = imread('peppers.png');
figure, imshow(I);
title('Original Image');
R = I(:,:,1);
G = I(:,:,2);
B = I(:,:,3);
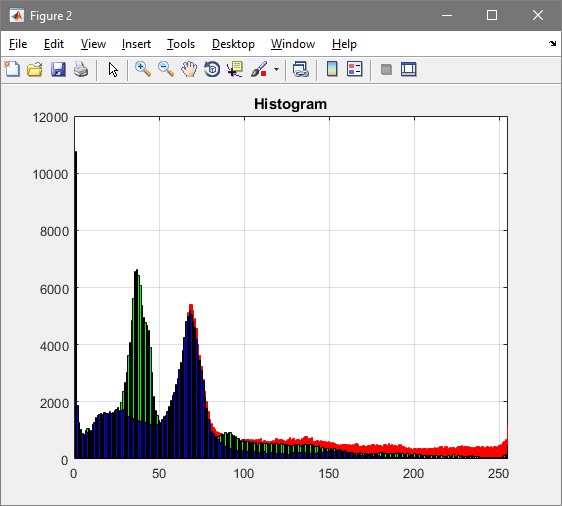
figure,
histogram(R(:),256,'FaceColor','r','EdgeColor','r')
hold on
histogram(G(:),256,'FaceColor','g','EdgeColor','g')
histogram(B(:),256,'FaceColor','b','EdgeColor','b')
set(gca,'XLim',[0 255])
set(gca,'YLim',[0 12000])
title('Histogram')
grid on
hold off
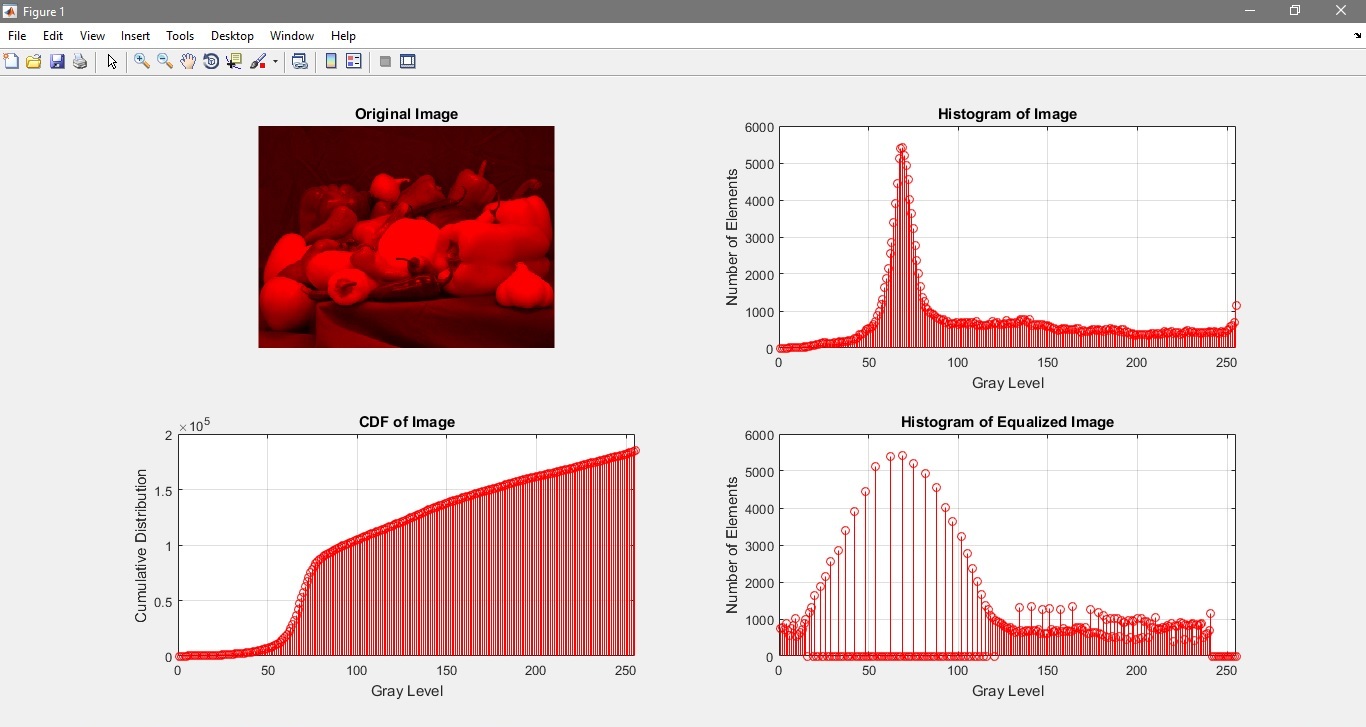
%% Red Channel
Red = cat(3,R,G*0,B*0);
figure,
subplot(2,2,1)
imshow(Red);
title('Original Image');
[rows,cols] = size(R);
% Histogram array
myhist = zeros(256,1);
for k = 0:255
myhist(k+1) = numel(find(R==k)); % number of elements where I has gray level equal to 'k'
end
subplot(2,2,2)
stem(myhist,'r');
set(gca,'XLim',[0 255])
xlabel('Gray Level')
ylabel('Number of Elements')
title('Histogram of Image')
grid on
% End of Histogram array
% Calculate cdf
cdf = zeros(256,1);
cdf(1) = myhist(1);
for k = 2:256
cdf(k) = cdf(k-1)+myhist(k);
end
subplot(2,2,3)
stem(cdf,'r');
set(gca,'XLim',[0 255])
xlabel('Gray Level')
ylabel('Cumulative Distribution')
title('CDF of Image')
grid on
% End of Calculate cdf
% Find Equalized histogram array
R_histeq = R;
cumprob = cdf/(rows.*cols);
equalizedhist = floor((cumprob).*255);
for i = 1:rows
for j = 1:cols
for m = 0:255
if (R(i,j)==m)
R_histeq(i,j) = equalizedhist(m+1);
end
end
end
end
% Equalized Histogram array
myeqhist = zeros(256,1);
for k = 0:255
myeqhist(k+1) = numel(find(R_histeq==k));
end
subplot(2,2,4)
stem(myeqhist,'r');
set(gca,'XLim',[0 255])
xlabel('Gray Level')
ylabel('Number of Elements')
title('Histogram of Equalized Image')
grid on
% End of Equalized Histogram array
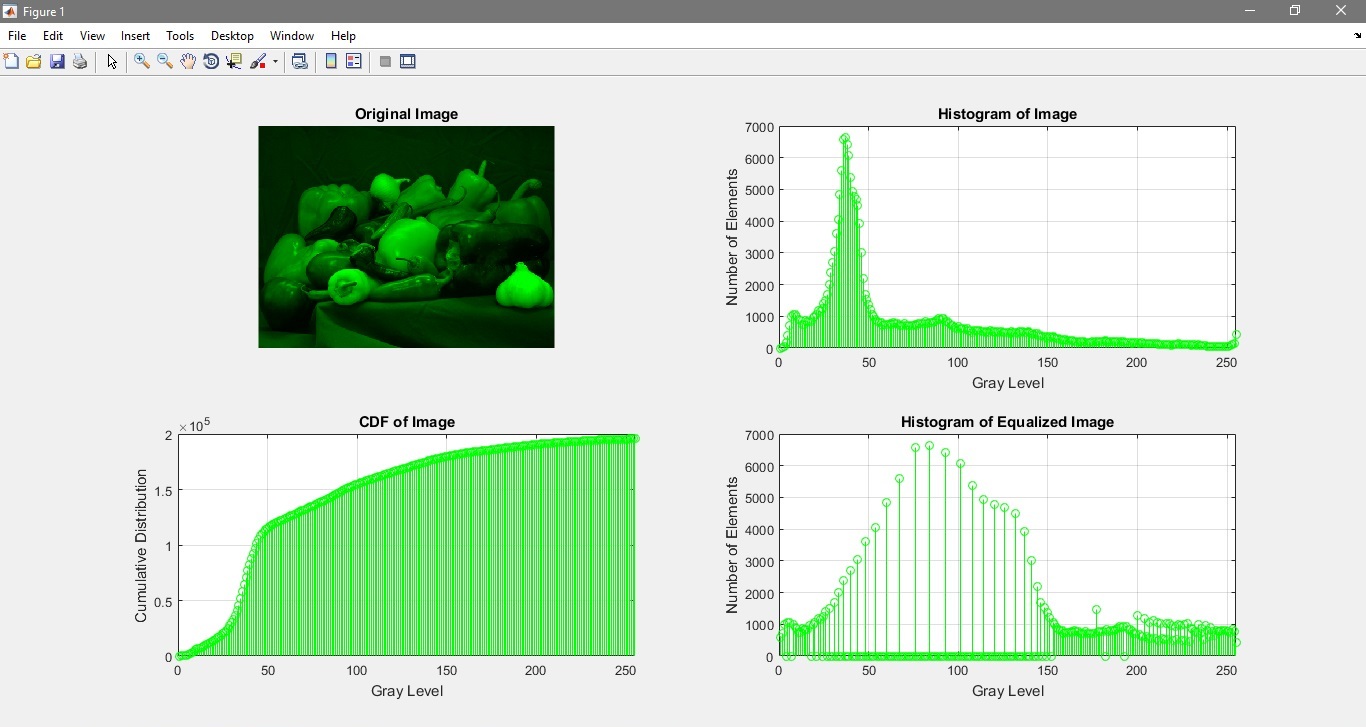
%% Green Channel
Green = cat(3,R*0,G,B*0);
figure,
subplot(2,2,1)
imshow(Green);
title('Original Image');
[rows,cols] = size(G);
% Histogram array
myhist = zeros(256,1);
for k = 0:255
myhist(k+1) = numel(find(G==k)); % number of elements where I has gray level equal to 'k'
end
subplot(2,2,2)
stem(myhist,'g');
set(gca,'XLim',[0 255])
xlabel('Gray Level')
ylabel('Number of Elements')
title('Histogram of Image')
grid on
% End of Histogram array
% Calculate cdf
cdf = zeros(256,1);
cdf(1) = myhist(1);
for k = 2:256
cdf(k) = cdf(k-1)+myhist(k);
end
subplot(2,2,3)
stem(cdf,'g');
set(gca,'XLim',[0 255])
xlabel('Gray Level')
ylabel('Cumulative Distribution')
title('CDF of Image')
grid on
% End of Calculate cdf
% Find Equalized histogram array
G_histeq = G;
cumprob = cdf/(rows.*cols);
equalizedhist = floor((cumprob).*255);
for i = 1:rows
for j = 1:cols
for m = 0:255
if (G(i,j)==m)
G_histeq(i,j) = equalizedhist(m+1);
end
end
end
end
% Equalized Histogram array
myeqhist = zeros(256,1);
for k = 0:255
myeqhist(k+1) = numel(find(G_histeq==k));
end
subplot(2,2,4)
stem(myeqhist,'g');
set(gca,'XLim',[0 255])
xlabel('Gray Level')
ylabel('Number of Elements')
title('Histogram of Equalized Image')
grid on
% End of Equalized Histogram array
%% Blue Channel
Blue = cat(3,R*0,G*0,B);
figure,
subplot(2,2,1)
imshow(Blue);
title('Original Image');
[rows,cols] = size(B);
% Histogram array
myhist = zeros(256,1);
for k = 0:255
myhist(k+1) = numel(find(B==k)); % number of elements where I has gray level equal to 'k'
end
subplot(2,2,2)
stem(myhist,'b');
set(gca,'XLim',[0 255])
xlabel('Gray Level')
ylabel('Number of Elements')
title('Histogram of Image')
grid on
% End of Histogram array
% Calculate cdf
cdf = zeros(256,1);
cdf(1) = myhist(1);
for k = 2:256
cdf(k) = cdf(k-1)+myhist(k);
end
subplot(2,2,3)
stem(cdf,'b');
set(gca,'XLim',[0 255])
xlabel('Gray Level')
ylabel('Cumulative Distribution')
title('CDF of Image')
grid on
% End of Calculate cdf
% Find Equalized histogram array
B_histeq = B;
cumprob = cdf/(rows.*cols);
equalizedhist = floor((cumprob).*255);
for i = 1:rows
for j = 1:cols
for m = 0:255
if (B(i,j)==m)
B_histeq(i,j) = equalizedhist(m+1);
end
end
end
end
% Equalized Histogram array
myeqhist = zeros(256,1);
for k = 0:255
myeqhist(k+1) = numel(find(B_histeq==k));
end
subplot(2,2,4)
stem(myeqhist,'b');
set(gca,'XLim',[0 255])
xlabel('Gray Level')
ylabel('Number of Elements')
title('Histogram of Equalized Image')
grid on
% End of Equalized Histogram array
%% Equalized Image
RGB = cat(3,R_histeq,G_histeq,B_histeq);
figure, imshow(RGB);
title('Equalized Image');
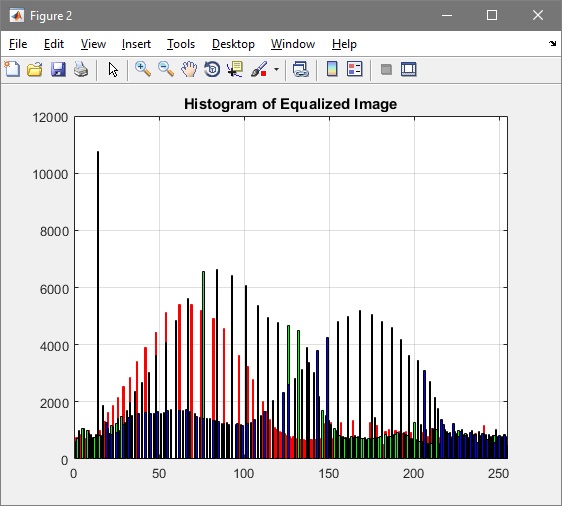
figure,
histogram(R_histeq(:),256,'FaceColor','r','EdgeColor','r')
hold on
histogram(G_histeq(:),256,'FaceColor','g','EdgeColor','g')
histogram(B_histeq(:),256,'FaceColor','b','EdgeColor','b')
set(gca,'XLim',[0 255])
set(gca,'YLim',[0 12000])
title('Histogram of Equalized Image')
grid on
hold off
File source code lengkap beserta citra pada pemrograman di atas dapat diperoleh pada halaman berikut ini: Source Code
Tutorial pembuatan App Designer MATLAB untuk melakukan contrast stretching dan histogram equalization dapat dilihat pada video berikut ini:
Posted on July 5, 2016, in Pengolahan Citra and tagged aplikasi pengolahan citra digital menggunakan matlab, aplikasi pengolahan citra menggunakan matlab, cara membuat cdf matlab, cara membuat cumulative distributive function matlab, cara membuat histogram citra matlab, cara membuat histogram ekualisasi matlab, cara membuat histogram equalization secara manual, cara membuat histogram matlab, contoh program matlab pengolahan citra, contoh program matlab sederhana, contoh program pengolahan citra digital menggunakan matlab, histeq matlab, histogram ekualisasi matlab, histogram equalization matlab, image enhancement matlab, menampilkan histogram citra digital, Pengolahan Citra Digital, pengolahan citra digital dan aplikasinya menggunakan matlab, pengolahan citra digital dengan matlab, pengolahan citra digital matlab, pengolahan citra digital menggunakan matlab, perbaikan kualitas citra matlab, source code matlab pengolahan citra, tutorial matlab untuk pengolahan citra. Bookmark the permalink. 12 Comments.


mas mau nanya
cara men save data histogram gimana ya? apa di save ny berupa gambar atau bisa berupa angka nya saja?
dan cara membandingkan 2 histogram bagiamana ya mas? jadi kaya sistem rekognisi gitu mas, yang paling kecil perbandinganny maka ditentukan jenis tersebut.
terima kasih sebelumny :))
misalnya variabel histogram adalah hist, perintah utk menyimpan variabel tsb adalah save hist.mat hist
untuk membandingkan dua buah histogram citra, bisa menggunakan parameter MSE (Mean Square Error), semakin kecil nilai MSE maka semakin mirip histogram kedua buah citra
perintah yang digunakan utk menghitung nilai MSE adalah
nilai_mse = mse(hist1,hist2)
oke mas, terima kasih pencerahannya 😀
Sama sama afif
mas mau nanya dong kalo aplikasi mendekteksi ke busukan insang ikan sebaiknya pakai metode apa ya ?
untuk proses tersebut bisa dilakukan dengan analisis warna dan tekstur
di sini ada contoh source nya bang tetang analisis warna sama tekstur ?
bisa dilihat pada halaman berikut
dan
kalo membandingkan insang 1 dengan 2 menggunakan grafik red histogram itu sudah termasuk dallam mendekteksi bukan bang ? #maaf banyak nanya
saya rasa membandingkan histogram akan sulit dilakukan untuk membedakan insang satu dengan lainnya
Mas mau nanya dong gimana caranya menampilkan histogram beserta rata2 dan standard deviasi suatu citra itu gimana ya
Untuk menampilkan histogram bisa menggunakan perintah imhist atau histogram
Sedangkan standard deviasi bisa menggunakan perintah std