
Citra dan Histogram menggunakan GUI Matlab
Karakteristik suatu citra digital dapat diketahui dengan cara menganalisis distribusi frekuensi nilai piksel pada histogramnya.
Berikut ini merupakan contoh GUI Matlab representasi histogram pada berbagai jenis citra digital. Pada jenis citra RGB, histogram ditampilkan pada masing-masing kanal warna yaitu kanal merah, kanal hiaju, dan kanal biru. Pada jenis citra grayscale, histogram ditampilkan hanya pada satu kanal warna berderajat keabuan. Sedangkan pada citra biner, histogram ditampilkan hanya pada satu kanal warna hitam dan putih.
Tampilan GUI Matlab untuk menampilkan citra digital dan histogramnya adalah sebagai berikut:
1. Citra RGB dan Histogramnya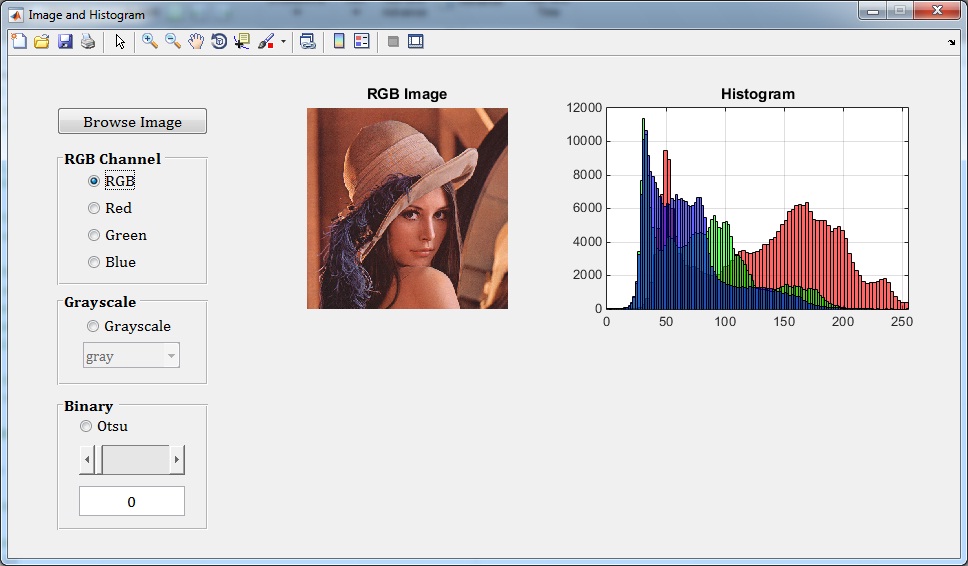
2. Kanal Merah dan Histogramnya
3. Kanal Hijau dan Histogramnya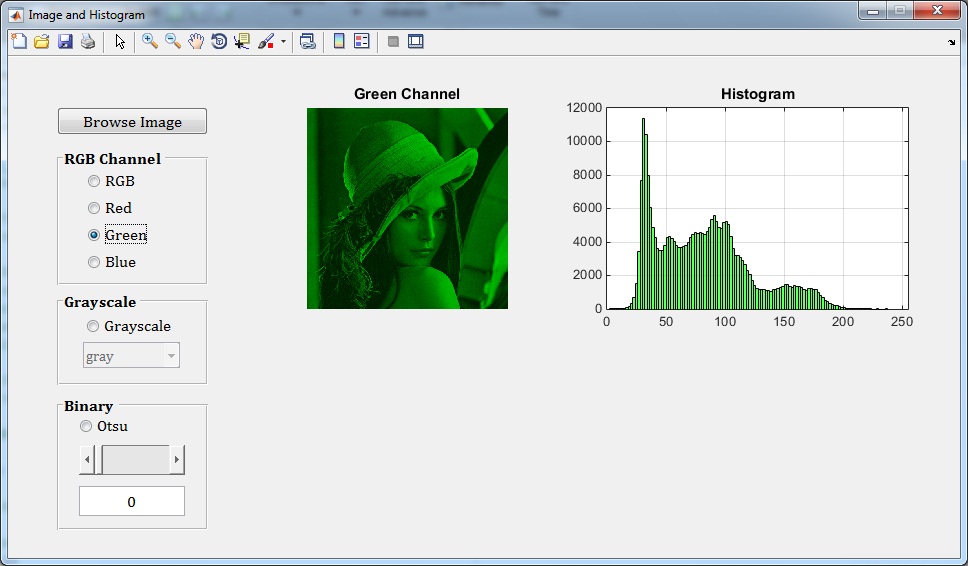
4. Kanal Biru dan Histogramnya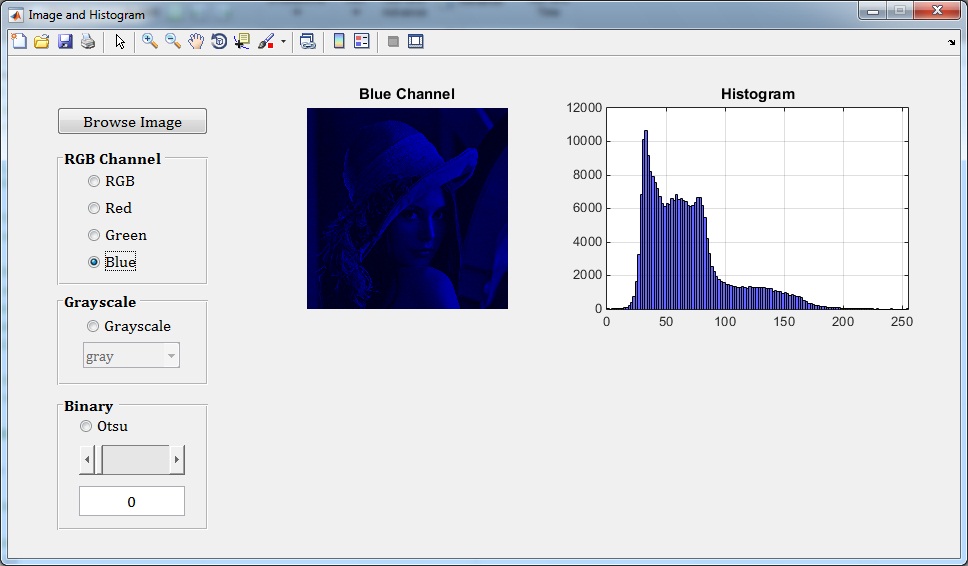
5. Citra Grayscale dan Histogramnya
6. Citra Grayscale (colormap parula) dan Histogramnya
7. Thresholding dengan metode Otsu
8. Thresholding dengan nilai threshold 0.3
9. Thresholding dengan nilai threshold 0.5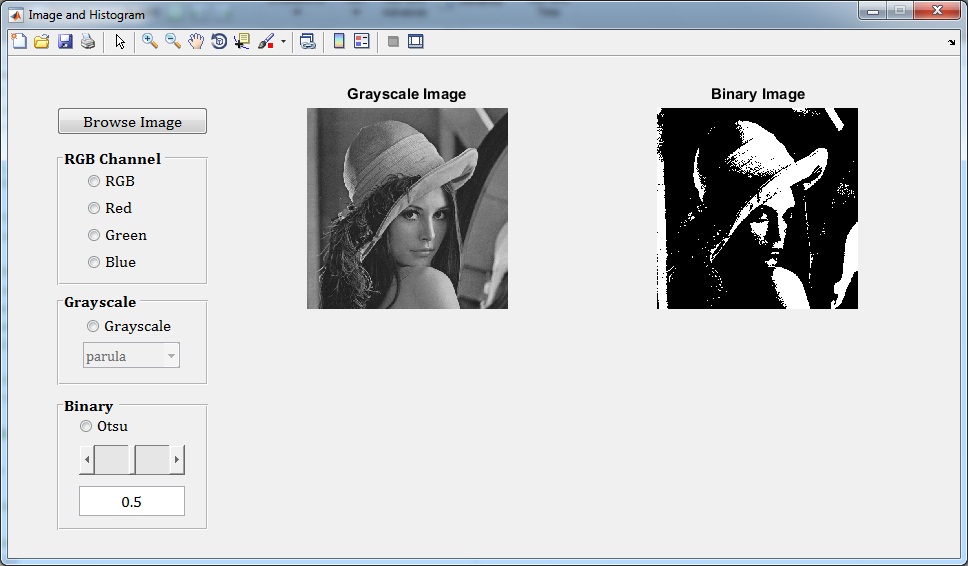
10. Thresholding dengan nilai threshold 0.7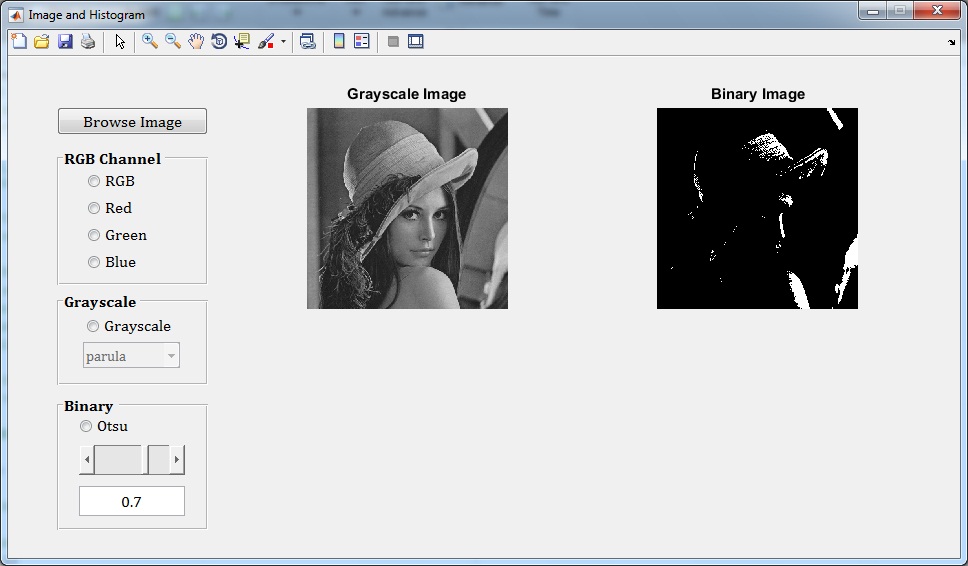
File source code lengkap beserta citra pada materi di atas dapat diperoleh melalui halaman berikut ini: Source Code
Sedangkan tampilan source codenya adalah:
% Adi Pamungkas, S.Si, M.Si
% Website: https://pemrogramanmatlab.com/
% Email  : adipamungkas@st.fisika.undip.ac.id

function varargout = Image_and_Histogram(varargin)
% Image_and_Histogram MATLAB code for Image_and_Histogram.fig
%      Image_and_Histogram, by itself, creates a new Image_and_Histogram or raises the existing
%      singleton*.
%
%      H = Image_and_Histogram returns the handle to a new Image_and_Histogram or the handle to
%      the existing singleton*.
%
%      Image_and_Histogram('CALLBACK',hObject,eventData,handles,...) calls the local
%      function named CALLBACK in Image_and_Histogram.M with the given input arguments.
%
%      Image_and_Histogram('Property','Value',...) creates a new Image_and_Histogram or raises the
%      existing singleton*.  Starting from the left, property value pairs are
%      applied to the GUI before Image_and_Histogram_OpeningFcn gets called.  An
%      unrecognized property name or invalid value makes property application
%      stop.  All inputs are passed to Image_and_Histogram_OpeningFcn via varargin.
%
%      *See GUI Options on GUIDE's Tools menu.  Choose "GUI allows only one
%      instance to run (singleton)".
%
% See also: GUIDE, GUIDATA, GUIHANDLES

% Edit the above text to modify the response to help Image_and_Histogram

% Last Modified by GUIDE v2.5 01-Jan-2017 15:49:49

% Begin initialization code - DO NOT EDIT
gui_Singleton = 1;
gui_State = struct('gui_Name',       mfilename, ...
                   'gui_Singleton',  gui_Singleton, ...
                   'gui_OpeningFcn', @Image_and_Histogram_OpeningFcn, ...
                   'gui_OutputFcn',  @Image_and_Histogram_OutputFcn, ...
                   'gui_LayoutFcn',  [] , ...
                   'gui_Callback',   []);
if nargin && ischar(varargin{1})
    gui_State.gui_Callback = str2func(varargin{1});
end

if nargout
    [varargout{1:nargout}] = gui_mainfcn(gui_State, varargin{:});
else
    gui_mainfcn(gui_State, varargin{:});
end
% End initialization code - DO NOT EDIT


% --- Executes just before Image_and_Histogram is made visible.
function Image_and_Histogram_OpeningFcn(hObject, eventdata, handles, varargin)
% This function has no output args, see OutputFcn.
% hObject    handle to figure
% eventdata  reserved - to be defined in a future version of MATLAB
% handles    structure with handles and user data (see GUIDATA)
% varargin   command line arguments to Image_and_Histogram (see VARARGIN)

% Choose default command line output for Image_and_Histogram
handles.output = hObject;

% Update handles structure
guidata(hObject, handles);
movegui(hObject,'center');
clc;clear;
% UIWAIT makes Image_and_Histogram wait for user response (see UIRESUME)
% uiwait(handles.figure1);


% --- Outputs from this function are returned to the command line.
function varargout = Image_and_Histogram_OutputFcn(hObject, eventdata, handles)
% varargout  cell array for returning output args (see VARARGOUT);
% hObject    handle to figure
% eventdata  reserved - to be defined in a future version of MATLAB
% handles    structure with handles and user data (see GUIDATA)

% Get default command line output from handles structure
varargout{1} = handles.output;


% --- Executes on button press in pushbutton1.
function pushbutton1_Callback(hObject, eventdata, handles)
% hObject    handle to pushbutton1 (see GCBO)
% eventdata  reserved - to be defined in a future version of MATLAB
% handles    structure with handles and user data (see GUIDATA)
[filename,pathname] = uigetfile({'*.*'});

if ~isequal(filename,0)
    Info = imfinfo(fullfile(pathname,filename));
    if Info.BitDepth == 24
        Img = imread(fullfile(pathname,filename));
        axes(handles.axes1)
        cla('reset')
        imshow(Img)
        title('RGB Image')
    else
        msgbox('Citra masukan harus citra RGB');
        return
    end
else
    return
end

handles.Img = Img;
guidata(hObject,handles);

set(handles.radiobutton1,'Enable','on')
set(handles.radiobutton2,'Enable','on')
set(handles.radiobutton3,'Enable','on')
set(handles.radiobutton4,'Enable','on')
set(handles.radiobutton5,'Enable','on')
set(handles.radiobutton6,'Enable','on')
set(handles.slider1,'Enable','on')
set(handles.edit1,'Enable','on')

axes(handles.axes2)
cla('reset')
set(gca,'XTick',[])
set(gca,'YTick',[])

% --- Executes on button press in radiobutton1.
function radiobutton1_Callback(hObject, eventdata, handles)
% hObject    handle to radiobutton1 (see GCBO)
% eventdata  reserved - to be defined in a future version of MATLAB
% handles    structure with handles and user data (see GUIDATA)

% Hint: get(hObject,'Value') returns toggle state of radiobutton1
set(handles.radiobutton1,'Value',1)
set(handles.radiobutton2,'Value',0)
set(handles.radiobutton3,'Value',0)
set(handles.radiobutton4,'Value',0)
set(handles.radiobutton5,'Value',0)
set(handles.radiobutton6,'Value',0)
set(handles.slider1,'Value',0)
set(handles.edit1,'String',0)
set(handles.popupmenu1,'Enable','off')

Img = handles.Img;
R = Img(:,:,1);
G = Img(:,:,2);
B = Img(:,:,3);
Red_Channel = cat(3,R,G*0,B*0);
axes(handles.axes1)
cla('reset')
imshow(Red_Channel)
title('Red Channel')
axes(handles.axes2)
cla('reset')
h = histogram(R(:));
h.FaceColor = [1 0 0];
xlim([0 255])
grid on
title('Histogram')

% --- Executes on button press in radiobutton2.
function radiobutton2_Callback(hObject, eventdata, handles)
% hObject    handle to radiobutton2 (see GCBO)
% eventdata  reserved - to be defined in a future version of MATLAB
% handles    structure with handles and user data (see GUIDATA)

% Hint: get(hObject,'Value') returns toggle state of radiobutton2
set(handles.radiobutton1,'Value',0)
set(handles.radiobutton2,'Value',1)
set(handles.radiobutton3,'Value',0)
set(handles.radiobutton4,'Value',0)
set(handles.radiobutton5,'Value',0)
set(handles.radiobutton6,'Value',0)
set(handles.slider1,'Value',0)
set(handles.edit1,'String',0)
set(handles.popupmenu1,'Enable','off')

Img = handles.Img;
R = Img(:,:,1);
G = Img(:,:,2);
B = Img(:,:,3);
Green_Channel = cat(3,R*0,G,B*0);
axes(handles.axes1)
cla('reset')
imshow(Green_Channel)
title('Green Channel')
axes(handles.axes2)
cla('reset')
h = histogram(G(:));
h.FaceColor = [0 1 0];
xlim([0 255])
grid on
title('Histogram')

% --- Executes on button press in radiobutton3.
function radiobutton3_Callback(hObject, eventdata, handles)
% hObject    handle to radiobutton3 (see GCBO)
% eventdata  reserved - to be defined in a future version of MATLAB
% handles    structure with handles and user data (see GUIDATA)

% Hint: get(hObject,'Value') returns toggle state of radiobutton3
set(handles.radiobutton1,'Value',0)
set(handles.radiobutton2,'Value',0)
set(handles.radiobutton3,'Value',1)
set(handles.radiobutton4,'Value',0)
set(handles.radiobutton5,'Value',0)
set(handles.radiobutton6,'Value',0)
set(handles.slider1,'Value',0)
set(handles.edit1,'String',0)
set(handles.popupmenu1,'Enable','off')

Img = handles.Img;
R = Img(:,:,1);
G = Img(:,:,2);
B = Img(:,:,3);
Blue_Channel = cat(3,R*0,G*0,B);
axes(handles.axes1)
cla('reset')
imshow(Blue_Channel)
title('Blue Channel')
axes(handles.axes2)
cla('reset')
h = histogram(B(:));
h.FaceColor = [0 0 1];
xlim([0 255])
grid on
title('Histogram')

% --- Executes on button press in radiobutton4.
function radiobutton4_Callback(hObject, eventdata, handles)
% hObject    handle to radiobutton4 (see GCBO)
% eventdata  reserved - to be defined in a future version of MATLAB
% handles    structure with handles and user data (see GUIDATA)

% Hint: get(hObject,'Value') returns toggle state of radiobutton4
set(handles.radiobutton1,'Value',0)
set(handles.radiobutton2,'Value',0)
set(handles.radiobutton3,'Value',0)
set(handles.radiobutton4,'Value',1)
set(handles.radiobutton5,'Value',0)
set(handles.radiobutton6,'Value',0)
set(handles.slider1,'Value',0)
set(handles.edit1,'String',0)
set(handles.popupmenu1,'Enable','on')

Img = handles.Img;
Gray = rgb2gray(Img);

Value = get(handles.popupmenu1,'Value');

axes(handles.axes1)
cla('reset')
imshow(Gray)
title('Grayscale Image')
switch Value
    case 1
        colormap gray
    case 2
        colormap parula
    case 3
        colormap jet
    case 4
        colormap hsv
    case 5
        colormap hot
    case 6
        colormap cool
    case 7
        colormap spring
    case 8
        colormap summer
    case 9
        colormap autumn
    case 10
        colormap winter
    case 11
        colormap bone
    case 12
        colormap copper
    case 13
        colormap pink
end

axes(handles.axes2)
cla('reset')
h = histogram(Gray(:));
h.FaceColor = [0.5 0.5 0.5];
xlim([0 255])
grid on
title('Histogram')

handles.Gray = Gray;
guidata(hObject,handles)


% --- Executes on button press in radiobutton5.
function radiobutton5_Callback(hObject, eventdata, handles)
% hObject    handle to radiobutton5 (see GCBO)
% eventdata  reserved - to be defined in a future version of MATLAB
% handles    structure with handles and user data (see GUIDATA)

% Hint: get(hObject,'Value') returns toggle state of radiobutton5
set(handles.radiobutton1,'Value',0)
set(handles.radiobutton2,'Value',0)
set(handles.radiobutton3,'Value',0)
set(handles.radiobutton4,'Value',0)
set(handles.radiobutton5,'Value',1)
set(handles.radiobutton6,'Value',0)
set(handles.slider1,'Value',0)
set(handles.edit1,'String',0)
set(handles.popupmenu1,'Enable','off')

Img = handles.Img;
Gray = rgb2gray(Img);
thresh = graythresh(Gray);
bw = im2bw(Gray,thresh);

axes(handles.axes1)
cla('reset')
imshow(Gray)
title('Grayscale Image')
axes(handles.axes2)
cla('reset')
imshow(bw)
title('Binary Image')
set(handles.edit1,'String',thresh)


% --- Executes on button press in radiobutton6.
function radiobutton6_Callback(hObject, eventdata, handles)
% hObject    handle to radiobutton6 (see GCBO)
% eventdata  reserved - to be defined in a future version of MATLAB
% handles    structure with handles and user data (see GUIDATA)

% Hint: get(hObject,'Value') returns toggle state of radiobutton6
set(handles.radiobutton1,'Value',0)
set(handles.radiobutton2,'Value',0)
set(handles.radiobutton3,'Value',0)
set(handles.radiobutton4,'Value',0)
set(handles.radiobutton5,'Value',0)
set(handles.radiobutton6,'Value',1)
set(handles.popupmenu1,'Enable','off')

Img = handles.Img;
axes(handles.axes1)
imshow(Img)
title('RGB Image')
R = Img(:,:,1);
G = Img(:,:,2);
B = Img(:,:,3);
axes(handles.axes2)
cla('reset')
h = histogram(R(:));
h.FaceColor = [1 0 0];
xlim([0 255])
grid on
hold on
h = histogram(G(:));
h.FaceColor = [0 1 0];
xlim([0 255])
h = histogram(B(:));
h.FaceColor = [0 0 1];
xlim([0 255])
hold off
title('Histogram')


% --- Executes on slider movement.
function slider1_Callback(hObject, eventdata, handles)
% hObject    handle to slider1 (see GCBO)
% eventdata  reserved - to be defined in a future version of MATLAB
% handles    structure with handles and user data (see GUIDATA)

% Hints: get(hObject,'Value') returns position of slider
%        get(hObject,'Min') and get(hObject,'Max') to determine range of slider
set(handles.radiobutton1,'Value',0)
set(handles.radiobutton2,'Value',0)
set(handles.radiobutton3,'Value',0)
set(handles.radiobutton4,'Value',0)
set(handles.radiobutton5,'Value',0)
set(handles.radiobutton6,'Value',0)
set(handles.popupmenu1,'Enable','off')

Img = handles.Img;
Gray = rgb2gray(Img);

thresh = get(hObject,'Value');
bw = im2bw(Gray,thresh);

axes(handles.axes1)
cla('reset')
imshow(Gray)
title('Grayscale Image')
axes(handles.axes2)
cla('reset')
imshow(bw)
title('Binary Image')
set(handles.edit1,'String',num2str(thresh))


% --- Executes during object creation, after setting all properties.
function slider1_CreateFcn(hObject, eventdata, handles)
% hObject    handle to slider1 (see GCBO)
% eventdata  reserved - to be defined in a future version of MATLAB
% handles    empty - handles not created until after all CreateFcns called

% Hint: slider controls usually have a light gray background.
if isequal(get(hObject,'BackgroundColor'), get(0,'defaultUicontrolBackgroundColor'))
    set(hObject,'BackgroundColor',[.9 .9 .9]);
end


function edit1_Callback(hObject, eventdata, handles)
% hObject    handle to edit1 (see GCBO)
% eventdata  reserved - to be defined in a future version of MATLAB
% handles    structure with handles and user data (see GUIDATA)

% Hints: get(hObject,'String') returns contents of edit1 as text
%        str2double(get(hObject,'String')) returns contents of edit1 as a double


% --- Executes during object creation, after setting all properties.
function edit1_CreateFcn(hObject, eventdata, handles)
% hObject    handle to edit1 (see GCBO)
% eventdata  reserved - to be defined in a future version of MATLAB
% handles    empty - handles not created until after all CreateFcns called

% Hint: edit controls usually have a white background on Windows.
%       See ISPC and COMPUTER.
if ispc && isequal(get(hObject,'BackgroundColor'), get(0,'defaultUicontrolBackgroundColor'))
    set(hObject,'BackgroundColor','white');
end


% --- Executes on selection change in popupmenu1.
function popupmenu1_Callback(hObject, eventdata, handles)
% hObject    handle to popupmenu1 (see GCBO)
% eventdata  reserved - to be defined in a future version of MATLAB
% handles    structure with handles and user data (see GUIDATA)

% Hints: contents = cellstr(get(hObject,'String')) returns popupmenu1 contents as cell array
%        contents{get(hObject,'Value')} returns selected item from popupmenu1
Value = get(hObject,'Value');

Gray = handles.Gray;
axes(handles.axes1)
cla('reset')
imshow(Gray)
title('Grayscale Image')
switch Value
    case 1
        colormap gray
    case 2
        colormap parula
    case 3
        colormap jet
    case 4
        colormap hsv
    case 5
        colormap hot
    case 6
        colormap cool
    case 7
        colormap spring
    case 8
        colormap summer
    case 9
        colormap autumn
    case 10
        colormap winter
    case 11
        colormap bone
    case 12
        colormap copper
    case 13
        colormap pink
end

% --- Executes during object creation, after setting all properties.
function popupmenu1_CreateFcn(hObject, eventdata, handles)
% hObject    handle to popupmenu1 (see GCBO)
% eventdata  reserved - to be defined in a future version of MATLAB
% handles    empty - handles not created until after all CreateFcns called

% Hint: popupmenu controls usually have a white background on Windows.
%       See ISPC and COMPUTER.
if ispc && isequal(get(hObject,'BackgroundColor'), get(0,'defaultUicontrolBackgroundColor'))
    set(hObject,'BackgroundColor','white');
end
Tutorial pembuatan App Designer MATLAB untuk menampilkan histogram citra digital bisa dilihat pada video berikut ini:

Posted on August 10, 2015, in Pengenalan Matlab, Pengolahan Citra and tagged cara membuat aplikasi gui matlab, cara membuat aplikasi histogram citra matlab, cara membuat histogram citra menggunakan matlab, cara menampilkan histogram citra matlab, citra biner, citra biner matlab, citra dan histogram, citra digital adalah, citra grayscale matlab, citra RGB, citra rgb matlab, contoh coding histogram matlab, dasar-dasar pengolahan citra digital, gui matlab, histogram citra adalah, histogram citra biner matlab, histogram citra grayscale matlab, histogram citra matlab, histogram citra rgb matlab, menampilkan histogram matlab, metode otsu matlab, operasi citra digital matlab, thresholding citra matlab. Bookmark the permalink. 5 Comments.


histogramnya kok tidak keluar ya mas adi, kenapa?
untuk koding tersebut minimal dapat dijalankan menggunakan matlab versi r2014b
menggunakan matlab 2010a kok gak bisa mas,,,apa gak support
koding tersebut dibuat menggunakan Matlab r2015b
mas mohon bantuan nya untuk membantu pengerjaan tugas saya bisa mboten…citra mri berderau kemudian dimedian filter lalu disegmentasi threshold