
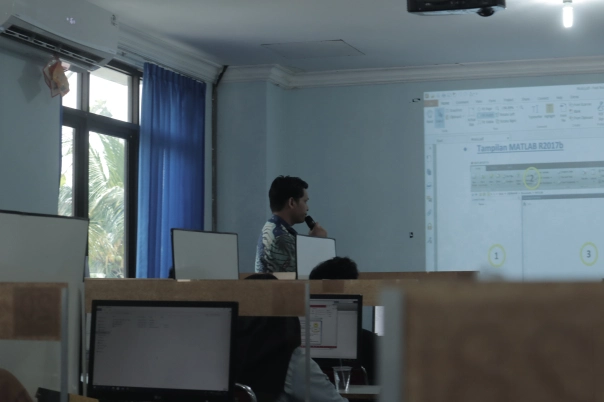
Perbaikan Kualitas Citra (Image Enhancement) menggunakan GUI Matlab
Perbaikan kualitas citra (image enhancement) merupakan salah satu tahapan yang dilakukan dalam pengolahan citra dan pengenalan pola. Tujuan dari perbaikan kualitas citra antara lain adalah:
1. Menonjolkan aspek tampilan tertentu agar lebih mudah dipahami atau diinterpretasi oleh penglihatan manusia
2. Mereduksi atau menghilangkan aspek tampilan dari suatu citra yang tidak diperlukan misalnya noise/derau
Perbaikan kualitas citra merupakan tahapan yang bersifat subjektif, opsional, dan eksperimentatif karena tidak ada algoritma yang baku dalam meningkatkan kualitas citra.
Operasi-operasi dalam perbaikan kualitas citra di antaranya yaitu operasi titik, operasi spasial, dan operasi transformasi.
Berikut ini merupakan contoh aplikasi pemrograman GUI Matlab mengenai perbaikan kualitas citra:
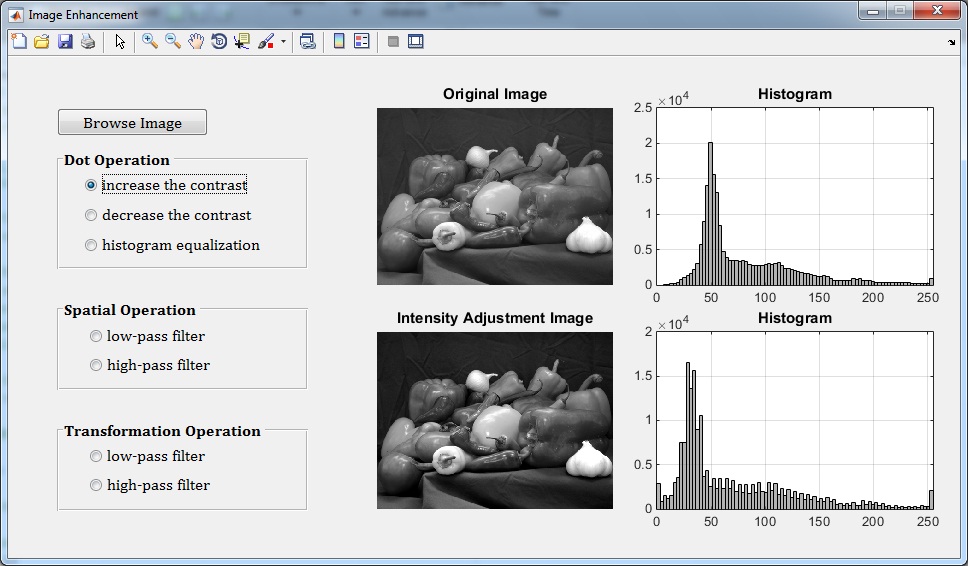
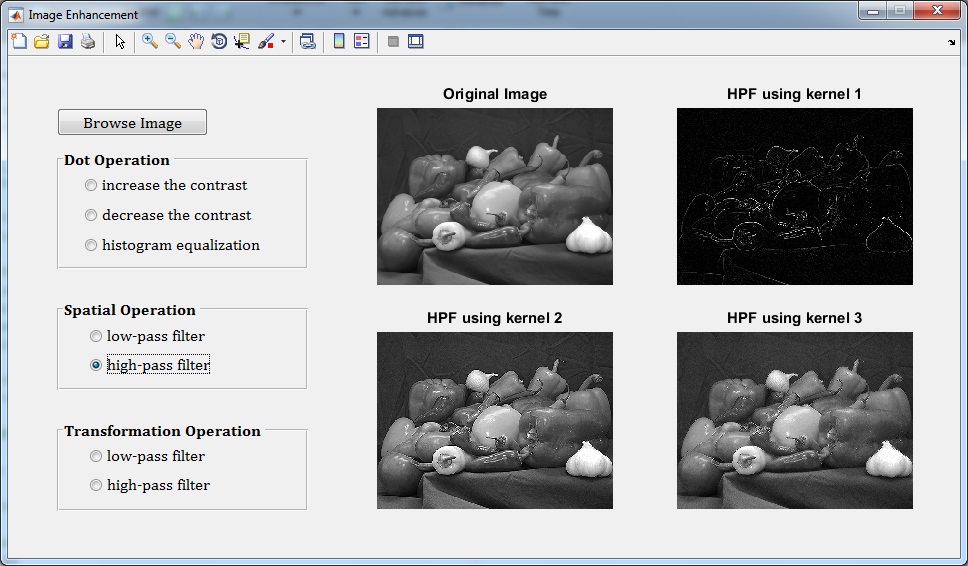
1. Peningkatan kontras
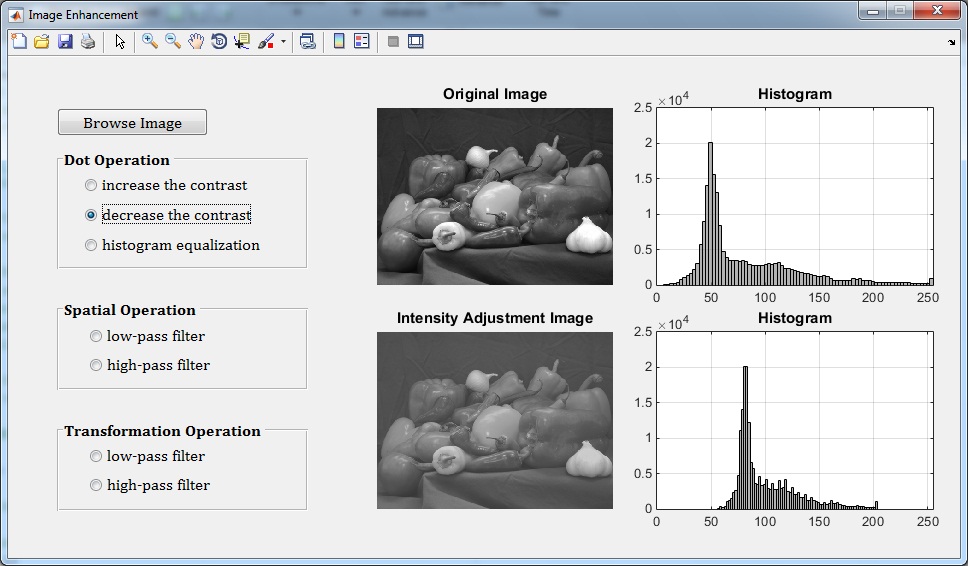
2. Penurunan kontras
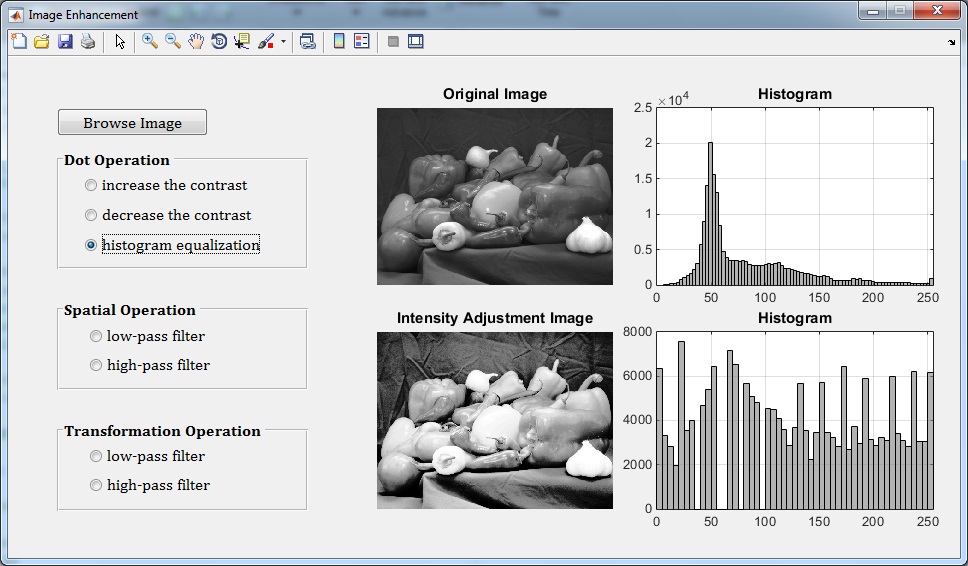
3. Histogram Equalization
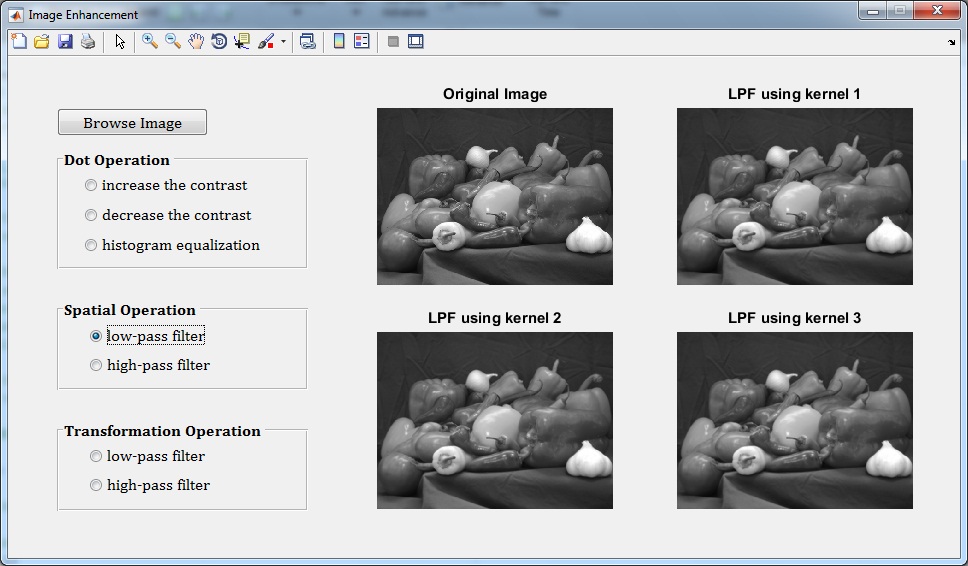
4. Low pass filter (Spatial Operation)
5. High pass filter (Spatial Operation)
6. Low pass filter (Transformation Operation)
![]()
7. High pass filter (Transformation Operation)
![]()
File source code lengkap beserta citra untuk proses perbaikan kualitas citra pada materi di atas dapat diperoleh melalui halaman berikut ini: Source Code
Sedangkan tampilan source codenya adalah:
function varargout = MODUL_2(varargin)
% MODUL_2 MATLAB code for MODUL_2.fig
%      MODUL_2, by itself, creates a new MODUL_2 or raises the existing
%      singleton*.
%
%      H = MODUL_2 returns the handle to a new MODUL_2 or the handle to
%      the existing singleton*.
%
%      MODUL_2('CALLBACK',hObject,eventData,handles,...) calls the local
%      function named CALLBACK in MODUL_2.M with the given input arguments.
%
%      MODUL_2('Property','Value',...) creates a new MODUL_2 or raises the
%      existing singleton*.  Starting from the left, property value pairs are
%      applied to the GUI before MODUL_2_OpeningFcn gets called.  An
%      unrecognized property name or invalid value makes property application
%      stop.  All inputs are passed to MODUL_2_OpeningFcn via varargin.
%
%      *See GUI Options on GUIDE's Tools menu.  Choose "GUI allows only one
%      instance to run (singleton)".
%
% See also: GUIDE, GUIDATA, GUIHANDLES

% Edit the above text to modify the response to help MODUL_2

% Last Modified by GUIDE v2.5 06-Aug-2015 12:13:32

% Begin initialization code - DO NOT EDIT
gui_Singleton = 1;
gui_State = struct('gui_Name',       mfilename, ...
                   'gui_Singleton',  gui_Singleton, ...
                   'gui_OpeningFcn', @MODUL_2_OpeningFcn, ...
                   'gui_OutputFcn',  @MODUL_2_OutputFcn, ...
                   'gui_LayoutFcn',  [] , ...
                   'gui_Callback',   []);
if nargin && ischar(varargin{1})
    gui_State.gui_Callback = str2func(varargin{1});
end

if nargout
    [varargout{1:nargout}] = gui_mainfcn(gui_State, varargin{:});
else
    gui_mainfcn(gui_State, varargin{:});
end
% End initialization code - DO NOT EDIT

% --- Executes just before MODUL_2 is made visible.
function MODUL_2_OpeningFcn(hObject, eventdata, handles, varargin)
% This function has no output args, see OutputFcn.
% hObject    handle to figure
% eventdata  reserved - to be defined in a future version of MATLAB
% handles    structure with handles and user data (see GUIDATA)
% varargin   command line arguments to MODUL_2 (see VARARGIN)

% Choose default command line output for MODUL_2
handles.output = hObject;

% Update handles structure
guidata(hObject, handles);
movegui(hObject,'center');
clc;clear;
% UIWAIT makes MODUL_2 wait for user response (see UIRESUME)
% uiwait(handles.figure1);

% --- Outputs from this function are returned to the command line.
function varargout = MODUL_2_OutputFcn(hObject, eventdata, handles)
% varargout  cell array for returning output args (see VARARGOUT);
% hObject    handle to figure
% eventdata  reserved - to be defined in a future version of MATLAB
% handles    structure with handles and user data (see GUIDATA)

% Get default command line output from handles structure
varargout{1} = handles.output;

% --- Executes on button press in pushbutton1.
function pushbutton1_Callback(hObject, eventdata, handles)
% hObject    handle to pushbutton1 (see GCBO)
% eventdata  reserved - to be defined in a future version of MATLAB
% handles    structure with handles and user data (see GUIDATA)
[filename,pathname] = uigetfile({'*.*'});

if ~isequal(filename,0)
    Info = imfinfo(fullfile(pathname,filename));
    if Info.BitDepth == 1
        msgbox('Citra masukan harus citra RGB atau Grayscale');
        return
    elseif Info.BitDepth == 8
        Img = imread(fullfile(pathname,filename));
        axes(handles.axes1)
        cla('reset')
        imshow(Img)
        title('Original Image')
    else
        Img = rgb2gray(imread(fullfile(pathname,filename)));
        axes(handles.axes1)
        cla('reset')
        imshow(Img)
        title('Original Image')
    end
else
    return
end

handles.Img = Img;
guidata(hObject,handles);

set(handles.radiobutton1,'Enable','on')
set(handles.radiobutton2,'Enable','on')
set(handles.radiobutton3,'Enable','on')
set(handles.radiobutton4,'Enable','on')
set(handles.radiobutton5,'Enable','on')
set(handles.radiobutton6,'Enable','on')
set(handles.radiobutton7,'Enable','on')
axes(handles.axes2)
cla('reset')
set(gca,'XTick',[])
set(gca,'YTick',[])
axes(handles.axes3)
cla('reset')
set(gca,'XTick',[])
set(gca,'YTick',[])
axes(handles.axes4)
cla('reset')
set(gca,'XTick',[])
set(gca,'YTick',[])

% --- Executes on button press in radiobutton1.
function radiobutton1_Callback(hObject, eventdata, handles)
% hObject    handle to radiobutton1 (see GCBO)
% eventdata  reserved - to be defined in a future version of MATLAB
% handles    structure with handles and user data (see GUIDATA)

% Hint: get(hObject,'Value') returns toggle state of radiobutton1
set(handles.radiobutton1,'Value',1)
set(handles.radiobutton2,'Value',0)
set(handles.radiobutton3,'Value',0)
set(handles.radiobutton4,'Value',0)
set(handles.radiobutton5,'Value',0)
set(handles.radiobutton6,'Value',0)
set(handles.radiobutton7,'Value',0)

Img = handles.Img;
I_adjust = imadjust(Img);

axes(handles.axes1)
cla('reset')
imshow(Img)
colormap(handles.axes1,'gray')
title('Original Image')

axes(handles.axes2)
h = histogram(Img(:));
h.FaceColor = [0.5 0.5 0.5];
xlim([0 255])
grid on
title('Histogram')

axes(handles.axes3)
cla('reset')
imshow(I_adjust)
colormap(handles.axes3,'gray')
title('Intensity Adjustment Image')

axes(handles.axes4)
h = histogram(I_adjust(:));
h.FaceColor = [0.5 0.5 0.5];
xlim([0 255])
grid on
title('Histogram')

% --- Executes on button press in radiobutton2.
function radiobutton2_Callback(hObject, eventdata, handles)
% hObject    handle to radiobutton2 (see GCBO)
% eventdata  reserved - to be defined in a future version of MATLAB
% handles    structure with handles and user data (see GUIDATA)

% Hint: get(hObject,'Value') returns toggle state of radiobutton2
set(handles.radiobutton1,'Value',0)
set(handles.radiobutton2,'Value',1)
set(handles.radiobutton3,'Value',0)
set(handles.radiobutton4,'Value',0)
set(handles.radiobutton5,'Value',0)
set(handles.radiobutton6,'Value',0)
set(handles.radiobutton7,'Value',0)

Img = handles.Img;
I_adjust = imadjust(Img,[0 1],[0.2 0.8]);

axes(handles.axes1)
cla('reset')
imshow(Img)
colormap(handles.axes1,'gray')
title('Original Image')

axes(handles.axes2)
h = histogram(Img(:));
h.FaceColor = [0.5 0.5 0.5];
xlim([0 255])
grid on
title('Histogram')

axes(handles.axes3)
cla('reset')
imshow(I_adjust)
colormap(handles.axes3,'gray')
title('Intensity Adjustment Image')

axes(handles.axes4)
h = histogram(I_adjust(:));
h.FaceColor = [0.5 0.5 0.5];
xlim([0 255])
grid on
title('Histogram')

% --- Executes on button press in radiobutton3.
function radiobutton3_Callback(hObject, eventdata, handles)
% hObject    handle to radiobutton3 (see GCBO)
% eventdata  reserved - to be defined in a future version of MATLAB
% handles    structure with handles and user data (see GUIDATA)

% Hint: get(hObject,'Value') returns toggle state of radiobutton3
set(handles.radiobutton1,'Value',0)
set(handles.radiobutton2,'Value',0)
set(handles.radiobutton3,'Value',1)
set(handles.radiobutton4,'Value',0)
set(handles.radiobutton5,'Value',0)
set(handles.radiobutton6,'Value',0)
set(handles.radiobutton7,'Value',0)

Img = handles.Img;
I_adjust = histeq(Img);

axes(handles.axes1)
cla('reset')
imshow(Img)
colormap(handles.axes1,'gray')
title('Original Image')

axes(handles.axes2)
h = histogram(Img(:));
h.FaceColor = [0.5 0.5 0.5];
xlim([0 255])
grid on
title('Histogram')

axes(handles.axes3)
cla('reset')
imshow(I_adjust)
colormap(handles.axes3,'gray')
title('Intensity Adjustment Image')

axes(handles.axes4)
h = histogram(I_adjust(:));
h.FaceColor = [0.5 0.5 0.5];
xlim([0 255])
grid on
title('Histogram')

% --- Executes on button press in radiobutton4.
function radiobutton4_Callback(hObject, eventdata, handles)
% hObject    handle to radiobutton4 (see GCBO)
% eventdata  reserved - to be defined in a future version of MATLAB
% handles    structure with handles and user data (see GUIDATA)

% Hint: get(hObject,'Value') returns toggle state of radiobutton4
set(handles.radiobutton1,'Value',0)
set(handles.radiobutton2,'Value',0)
set(handles.radiobutton3,'Value',0)
set(handles.radiobutton4,'Value',1)
set(handles.radiobutton5,'Value',0)
set(handles.radiobutton6,'Value',0)
set(handles.radiobutton7,'Value',0)

Img = handles.Img;
lpf1 = [1/16 1/8 1/16; 1/8 1/4 1/8; 1/16 1/8 1/16];
lpf2 = [1/10 1/10 1/10; 1/10 1/5 1/10; 1/10 1/10 1/10];
lpf3 = [1 1 1; 1 1 1; 1 1 1]/9;
J1 = uint8(conv2(double(Img),lpf1,'same'));
J2 = uint8(conv2(double(Img),lpf2,'same'));
J3 = uint8(conv2(double(Img),lpf3,'same'));

axes(handles.axes1)
cla('reset')
imshow(Img)
colormap(handles.axes1,'gray')
title('Original Image')

axes(handles.axes2)
cla('reset')
imshow(J1)
colormap(handles.axes2,'gray')
title('LPF using kernel 1')

axes(handles.axes3)
cla('reset')
imshow(J2)
colormap(handles.axes3,'gray')
title('LPF using kernel 2')

axes(handles.axes4)
cla('reset')
imshow(J3)
colormap(handles.axes4,'gray')
title('LPF using kernel 3')

% --- Executes on button press in radiobutton5.
function radiobutton5_Callback(hObject, eventdata, handles)
% hObject    handle to radiobutton5 (see GCBO)
% eventdata  reserved - to be defined in a future version of MATLAB
% handles    structure with handles and user data (see GUIDATA)

% Hint: get(hObject,'Value') returns toggle state of radiobutton5
set(handles.radiobutton1,'Value',0)
set(handles.radiobutton2,'Value',0)
set(handles.radiobutton3,'Value',0)
set(handles.radiobutton4,'Value',0)
set(handles.radiobutton5,'Value',1)
set(handles.radiobutton6,'Value',0)
set(handles.radiobutton7,'Value',0)

Img = handles.Img;
hpf1 = [-1 -1 -1; -1 8 -1; -1 -1 -1];
hpf2 = [0 -1 0; -1 5 -1; 0 -1 0];
hpf3 = [1 -2 1; -2 5 -2; 1 -2 1];
J1 = uint8(conv2(double(Img),hpf1,'same'));
J2 = uint8(conv2(double(Img),hpf2,'same'));
J3 = uint8(conv2(double(Img),hpf3,'same'));

axes(handles.axes1)
cla('reset')
imshow(Img)
colormap(handles.axes1,'gray')
title('Original Image')

axes(handles.axes2)
cla('reset')
imshow(J1)
colormap(handles.axes2,'gray')
title('HPF using kernel 1')

axes(handles.axes3)
cla('reset')
imshow(J2)
colormap(handles.axes3,'gray')
title('HPF using kernel 2')

axes(handles.axes4)
cla('reset')
imshow(J3)
colormap(handles.axes4,'gray')
title('HPF using kernel 3')

% --- Executes on button press in radiobutton6.
function radiobutton6_Callback(hObject, eventdata, handles)
% hObject    handle to radiobutton6 (see GCBO)
% eventdata  reserved - to be defined in a future version of MATLAB
% handles    structure with handles and user data (see GUIDATA)

% Hint: get(hObject,'Value') returns toggle state of radiobutton6
set(handles.radiobutton1,'Value',0)
set(handles.radiobutton2,'Value',0)
set(handles.radiobutton3,'Value',0)
set(handles.radiobutton4,'Value',0)
set(handles.radiobutton5,'Value',0)
set(handles.radiobutton6,'Value',1)
set(handles.radiobutton7,'Value',0)

Img=handles.Img;
Img = imresize(Img,[256,256]);
IF=fft2(double(Img));
mask_high=double(imread('maskpojok.bmp'));
mask_low=1-mask_high;
IFL=(IF.*mask_low );
hasil_low=abs(ifft2(IFL));

axes(handles.axes1)
imagesc(Img),colorbar,axis image;
colormap(handles.axes1,'gray')
title('Original Image (Spatial Domain)')
axes(handles.axes2)
imagesc(log(abs(IF +1)),[0 17]),colorbar,axis image;
colormap(handles.axes2,'hot')
title('Original Image (Frequency Domain)')
axes(handles.axes3)
imagesc(log(abs(IFL+1)),[0 17]),colorbar,axis image;
colormap(handles.axes3,'hot')
title('LPF Image (Frequency Domain)')
axes(handles.axes4)
imagesc(hasil_low ),colorbar,axis image;
colormap(handles.axes4,'gray')
title('LPF Image (Spatial Domain)')

% --- Executes on button press in radiobutton7.
function radiobutton7_Callback(hObject, eventdata, handles)
% hObject    handle to radiobutton7 (see GCBO)
% eventdata  reserved - to be defined in a future version of MATLAB
% handles    structure with handles and user data (see GUIDATA)

% Hint: get(hObject,'Value') returns toggle state of radiobutton7
set(handles.radiobutton1,'Value',0)
set(handles.radiobutton2,'Value',0)
set(handles.radiobutton3,'Value',0)
set(handles.radiobutton4,'Value',0)
set(handles.radiobutton5,'Value',0)
set(handles.radiobutton6,'Value',0)
set(handles.radiobutton7,'Value',1)

Img=handles.Img;
Img = imresize(Img,[256,256]);
IF=fft2(double(Img));
mask_high=double(imread('maskpojok.bmp'));
IFH=(IF.*mask_high);
hasil_high=abs(ifft2(IFH));

axes(handles.axes1)
imagesc(Img),colorbar,axis image;
colormap(handles.axes1,'gray')
title('Original Image (Spatial Domain)')
axes(handles.axes2)
imagesc(log(abs(IF +1)),[0 17]),colorbar,axis image;
colormap(handles.axes2,'hot')
title('Original Image (Frequency Domain)')
axes(handles.axes3)
imagesc(log(abs(IFH+1)),[0 17]),colorbar,axis image;
colormap(handles.axes3,'hot')
title('HPF Image (Frequency Domain)')
axes(handles.axes4)
imagesc(hasil_high),colorbar,axis image;
colormap(handles.axes4,'gray')
title('HPF Image (Spatial Domain)')
Posted on August 10, 2015, in Pengenalan Matlab, Pengolahan Citra and tagged aplikasi gui matlab pengolahan citra digital, aplikasi program perbaikan kualitas citra matlab, cara membuat koding perbaikan kualitas citra matlab, contoh aplikasi matlab perbaikan kualitas citra, contoh aplikasi program pengolahan citra digital, contoh gui matlab perbaikan kualitas citra digital, contoh image enhancement matlab, contoh koding perbaikan kualitas citra matlab, contoh perbaikan kualitas citra matlab, dot operation matlab, gui matlab, high pass filter matlab, histogram equalization matlab, image enhancement matlab, low pass filter matlab, operasi spasial citra matlab, operasi titik citra matlab, operasi transformasi citra matlab, peningkatan kontras citra matlab, perbaikan kualitas citra matlab, spatial operation matlab, transformation operation matlab. Bookmark the permalink. 10 Comments.


mau nanya, ini menggunakan matlab versi berapa ? Saya coba menggunakan matlab versi 7.01 kenapa gak bisa ya?
koding pada materi di atas dapat dijalankan pada matlab r2015b
Oke, terima kasih ya
Maaf mau nanya lagi ni. Gimana ya caranya menampilkan gambar aslinya juga saat di tampilkan? kalau disini kan gambar aslinya langsung di ubah jadi gambar grayscale. Cara menyisipkan gambar aslinya juga itu saya bingung gimana menyisipkan programnya
untuk menampilkan citra ke dalam sebuah axes bisa menggunakan perintah imshow
saya ingin bertanya, cara menentukan nilai matriks pada operasi high pass filter baik itu hpf1-hpf3 bagaimana ya? apakah ada perhitungan untuk mendapatkan nilai matriks tsb, atau dengan mencoba-coba? terimakasih sebelumnya.
untuk hpf jumlah semua koefisien kernel adalah 0 atau 1
mau tanya mas, kalau untuk function histogram pada matlab 2014 kok gak jalan ya, kalau di ganti hist pun perintah di atas munculnya Error using .*
Fungsi histogram dapat dijalankan pada matlab 2017 ke atas
mas mau tanya untuk tranformation operation disitu memerlukan maskpojok.bmp,
saya mau tanya dimana kita mendapadatkan file tersebut? apakah tersedia pada matlab? tolong pencerahannya karena saya stak dstu sya menggunakan matlab 2017
Source code dan file lengkap pada pemrograman matlab tsb bisa dibeli di tokopedia sehingga bisa langsung dijalankan tanpa error